Previous module |
Next module
Module #769, TG: 2.6, TC: 1.4, 81 probes, 81 Entrez genes, 14 conditions


HELP
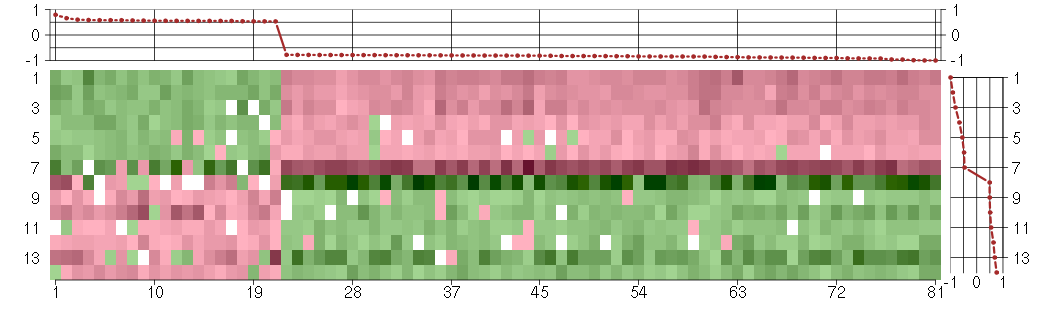
The image plot shows the color-coded level of gene expression, for the
genes and conditions in a given transcription module. The genes are on
the horizontal, the conditions on the vertical axis.
The genes are ordered according to their ISA gene scores, similarly
the conditions are ordered according to their condition scores. The
score of a gene means the «degree of inclusion» in
the module: a high score gene is essential in the module.
Condition scores can also be negative, that means that the genes of
the module are all down-regulated in the condition. Here the absolute
value of the score gives the «degree of inclusion».
The plots above and beside the expression matrix show the gene scores
and condition scores, respectively.
Note that the plot is interactive, you can see the name of the gene
and condition under the mouse cursor.
The expression matrix was normalized to have mean zero and standard
deviation one for every gene separately across all conditions
(i.e. not just for the conditions in the module).
— Click on the Help button again to close this help window.

Under-expression is coded with green,
over-expression with red color.
Help |
Hide |
Top
Help |
Show |
Top
The GO tree — Biological processes
HELP
This is one of three sections showing Gene Ontology enrichment of the
current module: in this case for biological processes.
The graph shows the hierarchy of the GO categories, their enrichment
for the current module is color coded, and the blue number beside the
category is the minus log ten p-value of the enrichment. (Calculated
using the standard hypergeometric test.) The color of the arrows code
«is a» (cyan) and «part of» relationships.
The tree was built the following way. First all GO terms with more
significant enrichment p-value than 0.05 were collected. Then all
paths from these terms to the root node of the GO tree were included
too. If a GO term is included more than once in the tree, then the
green numbers show 1) the id of the node, this makes it easier to find
other appereances of the term, and 2) the number of appearences.
Note that the same GO category might show up on the graph many
times. This is because the GO was «straightened» for this
graph, i.e. if there are more paths from a GO term to the root node of
the tree, all of them are included. The green numbers
Move the mouse cursor over the terms to get their definition. Clicking
on them takes you to the corresponding Gene Ontology web page.
If you cannot see a graph here at all, that means that there were no
significantly enriched GO categories, at the 0.05 level.
— Click on the Help button again to close this help window.

Help |
Hide |
Top
Help |
Show |
Top
The GO tree — Cellular Components
HELP
This is one of three sections showing Gene Ontology enrichment of the
current module: in this case for cellular components.
The graph shows the hierarchy of the GO categories, their enrichment
for the current module is color coded, and the blue number beside the
category is the minus log ten p-value of the enrichment. (Calculated
using the standard hypergeometric test.) The color of the arrows code
«is a» (cyan) and «part of» relationships.
The tree was built the following way. First all GO terms with more
significant enrichment p-value than 0.05 were collected. Then all
paths from these terms to the root node of the GO tree were included
too. If a GO term is included more than once in the tree, then the
green numbers show 1) the id of the node, this makes it easier to find
other appereances of the term, and 2) the number of appearences.
Note that the same GO category might show up on the graph many
times. This is because the GO was «straightened» for this
graph, i.e. if there are more paths from a GO term to the root node of
the tree, all of them are included. The green numbers
Move the mouse cursor over the terms to get their definition. Clicking
on them takes you to the corresponding Gene Ontology web page.
If you cannot see a graph here at all, that means that there were no
significantly enriched GO categories, at the 0.05 level.
— Click on the Help button again to close this help window.
Help |
Hide |
Top
Help |
Show |
Top
The GO tree — Molecular Function
HELP
This is one of three sections showing Gene Ontology enrichment of the
current module: in this case for molecular function.
The graph shows the hierarchy of the GO categories, their enrichment
for the current module is color coded, and the blue number beside the
category is the minus log ten p-value of the enrichment. (Calculated
using the standard hypergeometric test.) The color of the arrows code
«is a» (cyan) and «part of» relationships.
The tree was built the following way. First all GO terms with more
significant enrichment p-value than 0.05 were collected. Then all
paths from these terms to the root node of the GO tree were included
too. If a GO term is included more than once in the tree, then the
green numbers show 1) the id of the node, this makes it easier to find
other appereances of the term, and 2) the number of appearences.
Note that the same GO category might show up on the graph many
times. This is because the GO was «straightened» for this
graph, i.e. if there are more paths from a GO term to the root node of
the tree, all of them are included. The green numbers
Move the mouse cursor over the terms to get their definition. Clicking
on them takes you to the corresponding Gene Ontology web page.
If you cannot see a graph here at all, that means that there were no
significantly enriched GO categories, at the 0.05 level.
— Click on the Help button again to close this help window.
Help |
Hide |
Top
Help |
Show |
Top
GO BP test for over-representation
HELP
List of all enriched GO categories (biological processes), at the 0.05
p-value level.
The columns:
- ExpCount is the expected count of genes in the
module annotated with the given GO term, just by chance.
- Count
is the number of genes in the module annotated with the given GO
term.
- Size is the total number of genes (in our universe)
annotated with the GO term.
Clicking on Count shows the genes that drive the
enrichment. You can also click on the individual numbers in
the Count column, to show the driving genes for that individual
GO category.
Clicking on the GO identifiers takes you to the Gene Ontology web
pages.
— Click on the Help button again to close this help window.
| Id | Pvalue | ExpCount | Count | Size | Term |
| GO:0002076 | 3.347e-02 | 0.03769 | 2
JUND, SMAD3 | 5 | osteoblast development |
Help |
Hide |
Top
Help |
Show |
Top
GO CC test for over-representation
HELP
List of all enriched GO categories (cellular components), at the 0.05
p-value level.
The columns:
- ExpCount is the expected count of genes in the
module annotated with the given GO term, just by chance.
- Count
is the number of genes in the module annotated with the given GO
term.
- Size is the total number of genes (in our universe)
annotated with the GO term.
Clicking on Count shows the genes that drive the
enrichment. You can also click on the individual numbers in
the Count column, to show the driving genes for that individual
GO category.
Clicking on the GO identifiers takes you to the Gene Ontology web
pages.
— Click on the Help button again to close this help window.
Help |
Hide |
Top
Help |
Show |
Top
GO MF test for over-representation
HELP
List of all enriched GO categories (molecular function), at the 0.05
p-value level.
The columns:
- ExpCount is the expected count of genes in the
module annotated with the given GO term, just by chance.
- Count
is the number of genes in the module annotated with the given GO
term.
- Size is the total number of genes (in our universe)
annotated with the GO term.
Clicking on Count shows the genes that drive the
enrichment. You can also click on the individual numbers in
the Count column, to show the driving genes for that individual
GO category.
Clicking on the GO identifiers takes you to the Gene Ontology web
pages.
— Click on the Help button again to close this help window.
| Id | Pvalue | ExpCount | Count | Size | Term |
| GO:0004467 | 4.476e-02 | 0.04009 | 2
ACSL1, ACSL4 | 5 | long-chain-fatty-acid-CoA ligase activity |
| GO:0015645 | 4.476e-02 | 0.04009 | 2
ACSL1, ACSL4 | 5 | fatty-acid ligase activity |
Help |
Hide |
Top
Help |
Show |
Top
KEGG Pathway test for over-representation
HELP
List of all enriched KEGG pathways, at the 0.05
p-value level.
The columns:
- ExpCount is the expected count of genes in the
module annotated with the given KEGG pathway, just by chance.
- Count
is the number of genes in the module annotated with the given KEGG
pathway.
- Size is the total number of genes (in our universe)
annotated with the KEGG pathway.
Clicking on Count shows the genes that drive the
enrichment. You can also click on the individual numbers in
the Count column, to show the driving genes for that individual
KEGG pathway.
Clicking on the KEGG identifiers takes you to the KEGG web site.
— Click on the Help button again to close this help window.
Help |
Hide |
Top
Help |
Show |
Top
miRNA test for over-representation
HELP
List of all enriched miRNA families, at the 0.05
p-value level.
The columns:
- ExpCount is the expected count of genes in the
module regulated by the given miRNA family, just by chance.
- Count
is the number of genes in the module regulated by the given miRNA
family.
- Size is the total number of genes (in our universe)
regulated with the given miRNA family.
Clicking on Count shows the genes that drive the
enrichment. You can also click on the individual numbers in
the Count column, to show the driving genes for that individual
miRNA family.
The miRNA regulation data was taken from the TargetScan database.
(Only the conserved sites were used for the current analysis.)
Clicking on the miRNA names takes you to the TargetScan web site.
— Click on the Help button again to close this help window.
Help |
Hide |
Top
Help |
Show |
Top
Chromosome test for over-representation
HELP
List of all enriched Chromosomes, at the 0.05
p-value level.
The columns:
- ExpCount is the expected number of genes in the
module on the given chromosome, just by chance.
- Count
is the number of genes in the module on the given chromosome.
- Size is the total number of genes (in our universe)
on the given chromosome.
Clicking on Count shows the genes that drive the
enrichment. You can also click on the individual numbers in
the Count column, to show the driving genes for that individual
chromosome.
— Click on the Help button again to close this help window.
HELP
A list of all genes in the current module, in alphabetical order. The
size of the text corresponds to the gene scores.
Note that some gene symbols may show up more than once, if many
probes match the same Entrez gene.
Genes with no Entrez mapping are given separately, with their
Affymetrics probe ID.
— Click on the Help button again to close this help window.
Entrez genes
ABCE1ATP-binding cassette, sub-family E (OABP), member 1 (201873_s_at), score: -0.79
ACSL1acyl-CoA synthetase long-chain family member 1 (201963_at), score: -0.84
ACSL4acyl-CoA synthetase long-chain family member 4 (202422_s_at), score: -0.87
ASAP3ArfGAP with SH3 domain, ankyrin repeat and PH domain 3 (219103_at), score: 0.56
ATP2C1ATPase, Ca++ transporting, type 2C, member 1 (211137_s_at), score: -0.78
BBS10Bardet-Biedl syndrome 10 (219487_at), score: -0.79
BTBD2BTB (POZ) domain containing 2 (207722_s_at), score: 0.58
C10orf97chromosome 10 open reading frame 97 (218297_at), score: -0.84
C12orf29chromosome 12 open reading frame 29 (213701_at), score: -0.83
C4orf43chromosome 4 open reading frame 43 (218513_at), score: -0.89
C5orf44chromosome 5 open reading frame 44 (218674_at), score: -0.92
CALCOCO1calcium binding and coiled-coil domain 1 (209002_s_at), score: 0.55
CAPZA2capping protein (actin filament) muscle Z-line, alpha 2 (201237_at), score: -0.83
CD2APCD2-associated protein (203593_at), score: -0.84
CHMP5chromatin modifying protein 5 (218085_at), score: -0.8
CHORDC1cysteine and histidine-rich domain (CHORD)-containing 1 (218566_s_at), score: -0.92
CHUKconserved helix-loop-helix ubiquitous kinase (209666_s_at), score: -0.89
CICcapicua homolog (Drosophila) (212784_at), score: 0.58
CMPK1cytidine monophosphate (UMP-CMP) kinase 1, cytosolic (217870_s_at), score: -0.87
CSGALNACT2chondroitin sulfate N-acetylgalactosaminyltransferase 2 (222235_s_at), score: -0.8
DMWDdystrophia myotonica, WD repeat containing (213231_at), score: 0.58
DNAJB9DnaJ (Hsp40) homolog, subfamily B, member 9 (202843_at), score: -0.85
DTX4deltex homolog 4 (Drosophila) (212611_at), score: 0.54
EIF2AK3eukaryotic translation initiation factor 2-alpha kinase 3 (218696_at), score: -0.78
EIF4Eeukaryotic translation initiation factor 4E (201436_at), score: -0.9
ERBB2IPerbb2 interacting protein (217941_s_at), score: -0.78
FAM18Bfamily with sequence similarity 18, member B (218446_s_at), score: -1
FNDC3Afibronectin type III domain containing 3A (202304_at), score: -0.79
FRG1FSHD region gene 1 (204145_at), score: -0.79
G3BP2GTPase activating protein (SH3 domain) binding protein 2 (208841_s_at), score: -0.83
GK3Pglycerol kinase 3 pseudogene (215966_x_at), score: -0.81
GMCL1germ cell-less homolog 1 (Drosophila) (218458_at), score: -0.86
HISPPD1histidine acid phosphatase domain containing 1 (203253_s_at), score: -0.99
HSD17B6hydroxysteroid (17-beta) dehydrogenase 6 homolog (mouse) (37512_at), score: -0.85
JMJD1Cjumonji domain containing 1C (221763_at), score: -0.81
JUNDjun D proto-oncogene (203751_x_at), score: 0.66
KIAA1305KIAA1305 (220911_s_at), score: 0.57
LARP4La ribonucleoprotein domain family, member 4 (214155_s_at), score: -0.92
LOC100132540similar to LOC339047 protein (214870_x_at), score: 0.55
LOC286434hypothetical protein LOC286434 (222196_at), score: 0.55
LRRTM4leucine rich repeat transmembrane neuronal 4 (220345_at), score: 0.54
MATR3matrin 3 (200626_s_at), score: -0.78
MUC1mucin 1, cell surface associated (207847_s_at), score: 0.6
N4BP3Nedd4 binding protein 3 (214775_at), score: 0.55
NDUFA5NADH dehydrogenase (ubiquinone) 1 alpha subcomplex, 5, 13kDa (201304_at), score: -0.81
NRN1neuritin 1 (218625_at), score: 0.55
NUP160nucleoporin 160kDa (212709_at), score: -0.79
OPA1optic atrophy 1 (autosomal dominant) (212213_x_at), score: -0.79
OSTM1osteopetrosis associated transmembrane protein 1 (218196_at), score: -0.92
P2RY5purinergic receptor P2Y, G-protein coupled, 5 (218589_at), score: 0.57
PAQR3progestin and adipoQ receptor family member III (213372_at), score: -0.96
PNPLA2patatin-like phospholipase domain containing 2 (212705_x_at), score: 0.79
PRMT3protein arginine methyltransferase 3 (213320_at), score: -0.82
PTPROprotein tyrosine phosphatase, receptor type, O (211600_at), score: 0.56
PVRL3poliovirus receptor-related 3 (213325_at), score: -0.83
RAB1ARAB1A, member RAS oncogene family (213440_at), score: -0.9
RAB7ARAB7A, member RAS oncogene family (211960_s_at), score: -0.8
RANBP6RAN binding protein 6 (213019_at), score: -0.88
RECQLRecQ protein-like (DNA helicase Q1-like) (205091_x_at), score: -0.8
RP2retinitis pigmentosa 2 (X-linked recessive) (205191_at), score: -0.84
SACM1LSAC1 suppressor of actin mutations 1-like (yeast) (202797_at), score: -0.83
SH3D19SH3 domain containing 19 (211620_x_at), score: 0.53
SLC33A1solute carrier family 33 (acetyl-CoA transporter), member 1 (203165_s_at), score: -0.8
SLC4A7solute carrier family 4, sodium bicarbonate cotransporter, member 7 (209884_s_at), score: -0.89
SLMO2slowmo homolog 2 (Drosophila) (217851_s_at), score: -0.96
SMAD3SMAD family member 3 (218284_at), score: 0.54
SP3Sp3 transcription factor (213168_at), score: -0.8
SYNJ1synaptojanin 1 (212990_at), score: -0.8
TAF2TAF2 RNA polymerase II, TATA box binding protein (TBP)-associated factor, 150kDa (209523_at), score: -0.88
TCEB1transcription elongation factor B (SIII), polypeptide 1 (15kDa, elongin C) (202823_at), score: -0.81
TGDSTDP-glucose 4,6-dehydratase (208249_s_at), score: -0.81
TICAM2toll-like receptor adaptor molecule 2 (214658_at), score: -1
TM9SF3transmembrane 9 superfamily member 3 (217758_s_at), score: -0.83
TMED7transmembrane emp24 protein transport domain containing 7 (209404_s_at), score: -0.81
TMEM30Atransmembrane protein 30A (217743_s_at), score: -0.88
TMF1TATA element modulatory factor 1 (213024_at), score: -0.9
UFM1ubiquitin-fold modifier 1 (218050_at), score: -0.82
UHRF1BP1LUHRF1 binding protein 1-like (213118_at), score: -0.84
VENTXP1VENT homeobox (Xenopus laevis) pseudogene 1 (216722_at), score: 0.56
ZC3H14zinc finger CCCH-type containing 14 (213064_at), score: -0.79
ZDHHC7zinc finger, DHHC-type containing 7 (218606_at), score: 0.59
Non-Entrez genes
Unknown, score:
HELP
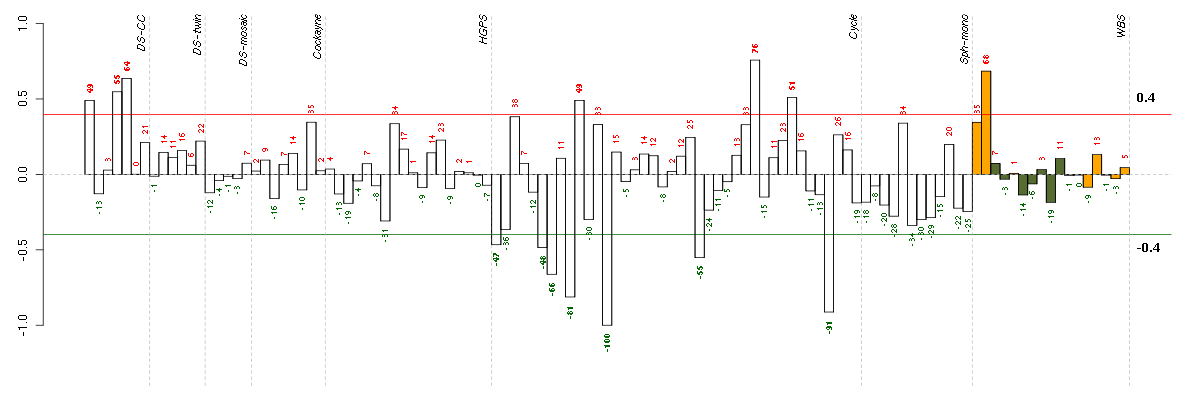
Conditions in the module, given in the same order as on the expression
plot above. Red color means over-expression, green under-expression in
the given condition.
The barplot below shows the condition (sample) scores. A separate bar
is shown for each sample, its height is the corresponding score of the
sample in the module. The red and green numbers on the bars are the
sample scores expressed in percents, i.e. 100% is 1.0.
The red and green lines show the module thresholds, samples above
the red line and below the green line are included in the module.
The different experiments that were part of the study, are separated
by dashed vertical lines.
— Click on the Help button again to close this help window.
| Id | sample | Experiment | ExpName | Array | Syndrome | Cell.line |
| E-TABM-263-raw-cel-1515485891.cel | 13 | 6 | Cycle | hgu133a2 | none | Cycle 1 |
| E-TABM-263-raw-cel-1515486371.cel | 37 | 6 | Cycle | hgu133a2 | none | Cycle 1 |
| E-TABM-263-raw-cel-1515485811.cel | 9 | 6 | Cycle | hgu133a2 | none | Cycle 1 |
| E-TABM-263-raw-cel-1515485771.cel | 7 | 6 | Cycle | hgu133a2 | none | Cycle 1 |
| E-TABM-263-raw-cel-1515486091.cel | 23 | 6 | Cycle | hgu133a2 | none | Cycle 1 |
| E-TABM-263-raw-cel-1515485751.cel | 6 | 6 | Cycle | hgu133a2 | none | Cycle 1 |
| E-TABM-263-raw-cel-1515485651.cel | 1 | 6 | Cycle | hgu133a2 | none | Cycle 1 |
| ctrl a 08-03.CEL | 1 | 1 | DS-CC | hgu133a | none | DS-CC 1 |
| E-TABM-263-raw-cel-1515485831.cel | 10 | 6 | Cycle | hgu133a2 | none | Cycle 1 |
| E-TABM-263-raw-cel-1515486291.cel | 33 | 6 | Cycle | hgu133a2 | none | Cycle 1 |
| t21a 08-03.CEL | 4 | 1 | DS-CC | hgu133a | Down | DS-CC 4 |
| t21b 08-03.CEL | 5 | 1 | DS-CC | hgu133a | Down | DS-CC 5 |
| 10590_WBS.CEL | 2 | 8 | WBS | hgu133plus2 | WBS | WBS 1 |
| E-TABM-263-raw-cel-1515486211.cel | 29 | 6 | Cycle | hgu133a2 | none | Cycle 1 |


© 2008-2010 Computational Biology Group, Department of Medical Genetics,
University of Lausanne, Switzerland