Previous module |
Next module
Module #807, TG: 2.4, TC: 2, 127 probes, 127 Entrez genes, 5 conditions


HELP
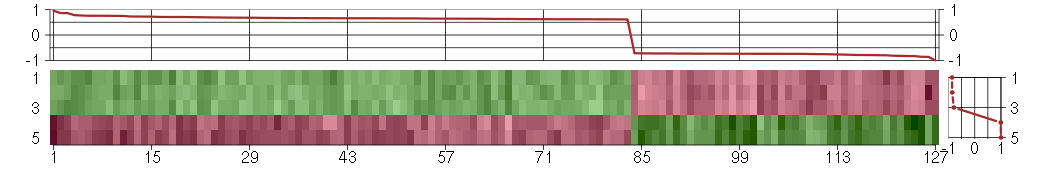
The image plot shows the color-coded level of gene expression, for the
genes and conditions in a given transcription module. The genes are on
the horizontal, the conditions on the vertical axis.
The genes are ordered according to their ISA gene scores, similarly
the conditions are ordered according to their condition scores. The
score of a gene means the «degree of inclusion» in
the module: a high score gene is essential in the module.
Condition scores can also be negative, that means that the genes of
the module are all down-regulated in the condition. Here the absolute
value of the score gives the «degree of inclusion».
The plots above and beside the expression matrix show the gene scores
and condition scores, respectively.
Note that the plot is interactive, you can see the name of the gene
and condition under the mouse cursor.
The expression matrix was normalized to have mean zero and standard
deviation one for every gene separately across all conditions
(i.e. not just for the conditions in the module).
— Click on the Help button again to close this help window.

Under-expression is coded with green,
over-expression with red color.
Help |
Hide |
Top
Help |
Show |
Top
The GO tree — Biological processes
HELP
This is one of three sections showing Gene Ontology enrichment of the
current module: in this case for biological processes.
The graph shows the hierarchy of the GO categories, their enrichment
for the current module is color coded, and the blue number beside the
category is the minus log ten p-value of the enrichment. (Calculated
using the standard hypergeometric test.) The color of the arrows code
«is a» (cyan) and «part of» relationships.
The tree was built the following way. First all GO terms with more
significant enrichment p-value than 0.05 were collected. Then all
paths from these terms to the root node of the GO tree were included
too. If a GO term is included more than once in the tree, then the
green numbers show 1) the id of the node, this makes it easier to find
other appereances of the term, and 2) the number of appearences.
Note that the same GO category might show up on the graph many
times. This is because the GO was «straightened» for this
graph, i.e. if there are more paths from a GO term to the root node of
the tree, all of them are included. The green numbers
Move the mouse cursor over the terms to get their definition. Clicking
on them takes you to the corresponding Gene Ontology web page.
If you cannot see a graph here at all, that means that there were no
significantly enriched GO categories, at the 0.05 level.
— Click on the Help button again to close this help window.

Help |
Hide |
Top
Help |
Show |
Top
The GO tree — Cellular Components
HELP
This is one of three sections showing Gene Ontology enrichment of the
current module: in this case for cellular components.
The graph shows the hierarchy of the GO categories, their enrichment
for the current module is color coded, and the blue number beside the
category is the minus log ten p-value of the enrichment. (Calculated
using the standard hypergeometric test.) The color of the arrows code
«is a» (cyan) and «part of» relationships.
The tree was built the following way. First all GO terms with more
significant enrichment p-value than 0.05 were collected. Then all
paths from these terms to the root node of the GO tree were included
too. If a GO term is included more than once in the tree, then the
green numbers show 1) the id of the node, this makes it easier to find
other appereances of the term, and 2) the number of appearences.
Note that the same GO category might show up on the graph many
times. This is because the GO was «straightened» for this
graph, i.e. if there are more paths from a GO term to the root node of
the tree, all of them are included. The green numbers
Move the mouse cursor over the terms to get their definition. Clicking
on them takes you to the corresponding Gene Ontology web page.
If you cannot see a graph here at all, that means that there were no
significantly enriched GO categories, at the 0.05 level.
— Click on the Help button again to close this help window.
Help |
Hide |
Top
Help |
Show |
Top
The GO tree — Molecular Function
HELP
This is one of three sections showing Gene Ontology enrichment of the
current module: in this case for molecular function.
The graph shows the hierarchy of the GO categories, their enrichment
for the current module is color coded, and the blue number beside the
category is the minus log ten p-value of the enrichment. (Calculated
using the standard hypergeometric test.) The color of the arrows code
«is a» (cyan) and «part of» relationships.
The tree was built the following way. First all GO terms with more
significant enrichment p-value than 0.05 were collected. Then all
paths from these terms to the root node of the GO tree were included
too. If a GO term is included more than once in the tree, then the
green numbers show 1) the id of the node, this makes it easier to find
other appereances of the term, and 2) the number of appearences.
Note that the same GO category might show up on the graph many
times. This is because the GO was «straightened» for this
graph, i.e. if there are more paths from a GO term to the root node of
the tree, all of them are included. The green numbers
Move the mouse cursor over the terms to get their definition. Clicking
on them takes you to the corresponding Gene Ontology web page.
If you cannot see a graph here at all, that means that there were no
significantly enriched GO categories, at the 0.05 level.
— Click on the Help button again to close this help window.
Help |
Hide |
Top
Help |
Show |
Top
GO BP test for over-representation
HELP
List of all enriched GO categories (biological processes), at the 0.05
p-value level.
The columns:
- ExpCount is the expected count of genes in the
module annotated with the given GO term, just by chance.
- Count
is the number of genes in the module annotated with the given GO
term.
- Size is the total number of genes (in our universe)
annotated with the GO term.
Clicking on Count shows the genes that drive the
enrichment. You can also click on the individual numbers in
the Count column, to show the driving genes for that individual
GO category.
Clicking on the GO identifiers takes you to the Gene Ontology web
pages.
— Click on the Help button again to close this help window.
Help |
Hide |
Top
Help |
Show |
Top
GO CC test for over-representation
HELP
List of all enriched GO categories (cellular components), at the 0.05
p-value level.
The columns:
- ExpCount is the expected count of genes in the
module annotated with the given GO term, just by chance.
- Count
is the number of genes in the module annotated with the given GO
term.
- Size is the total number of genes (in our universe)
annotated with the GO term.
Clicking on Count shows the genes that drive the
enrichment. You can also click on the individual numbers in
the Count column, to show the driving genes for that individual
GO category.
Clicking on the GO identifiers takes you to the Gene Ontology web
pages.
— Click on the Help button again to close this help window.
Help |
Hide |
Top
Help |
Show |
Top
GO MF test for over-representation
HELP
List of all enriched GO categories (molecular function), at the 0.05
p-value level.
The columns:
- ExpCount is the expected count of genes in the
module annotated with the given GO term, just by chance.
- Count
is the number of genes in the module annotated with the given GO
term.
- Size is the total number of genes (in our universe)
annotated with the GO term.
Clicking on Count shows the genes that drive the
enrichment. You can also click on the individual numbers in
the Count column, to show the driving genes for that individual
GO category.
Clicking on the GO identifiers takes you to the Gene Ontology web
pages.
— Click on the Help button again to close this help window.
Help |
Hide |
Top
Help |
Show |
Top
KEGG Pathway test for over-representation
HELP
List of all enriched KEGG pathways, at the 0.05
p-value level.
The columns:
- ExpCount is the expected count of genes in the
module annotated with the given KEGG pathway, just by chance.
- Count
is the number of genes in the module annotated with the given KEGG
pathway.
- Size is the total number of genes (in our universe)
annotated with the KEGG pathway.
Clicking on Count shows the genes that drive the
enrichment. You can also click on the individual numbers in
the Count column, to show the driving genes for that individual
KEGG pathway.
Clicking on the KEGG identifiers takes you to the KEGG web site.
— Click on the Help button again to close this help window.
Help |
Hide |
Top
Help |
Show |
Top
miRNA test for over-representation
HELP
List of all enriched miRNA families, at the 0.05
p-value level.
The columns:
- ExpCount is the expected count of genes in the
module regulated by the given miRNA family, just by chance.
- Count
is the number of genes in the module regulated by the given miRNA
family.
- Size is the total number of genes (in our universe)
regulated with the given miRNA family.
Clicking on Count shows the genes that drive the
enrichment. You can also click on the individual numbers in
the Count column, to show the driving genes for that individual
miRNA family.
The miRNA regulation data was taken from the TargetScan database.
(Only the conserved sites were used for the current analysis.)
Clicking on the miRNA names takes you to the TargetScan web site.
— Click on the Help button again to close this help window.
Help |
Hide |
Top
Help |
Show |
Top
Chromosome test for over-representation
HELP
List of all enriched Chromosomes, at the 0.05
p-value level.
The columns:
- ExpCount is the expected number of genes in the
module on the given chromosome, just by chance.
- Count
is the number of genes in the module on the given chromosome.
- Size is the total number of genes (in our universe)
on the given chromosome.
Clicking on Count shows the genes that drive the
enrichment. You can also click on the individual numbers in
the Count column, to show the driving genes for that individual
chromosome.
— Click on the Help button again to close this help window.
HELP
A list of all genes in the current module, in alphabetical order. The
size of the text corresponds to the gene scores.
Note that some gene symbols may show up more than once, if many
probes match the same Entrez gene.
Genes with no Entrez mapping are given separately, with their
Affymetrics probe ID.
— Click on the Help button again to close this help window.
Entrez genes
ABHD2abhydrolase domain containing 2 (63825_at), score: 0.65
ACO1aconitase 1, soluble (207071_s_at), score: -0.72
ADIPOR1adiponectin receptor 1 (217748_at), score: 0.75
ALDH1A1aldehyde dehydrogenase 1 family, member A1 (212224_at), score: -0.73
ARL15ADP-ribosylation factor-like 15 (219842_at), score: -0.75
ATP6V0BATPase, H+ transporting, lysosomal 21kDa, V0 subunit b (200078_s_at), score: 0.64
BRF2BRF2, subunit of RNA polymerase III transcription initiation factor, BRF1-like (218955_at), score: 0.61
C12orf35chromosome 12 open reading frame 35 (218614_at), score: 0.65
C14orf169chromosome 14 open reading frame 169 (219526_at), score: -0.74
C17orf86chromosome 17 open reading frame 86 (221621_at), score: 0.62
C20orf11chromosome 20 open reading frame 11 (218448_at), score: 0.64
C20orf111chromosome 20 open reading frame 111 (209020_at), score: 0.69
C6orf62chromosome 6 open reading frame 62 (222309_at), score: 0.66
CABC1chaperone, ABC1 activity of bc1 complex homolog (S. pombe) (218168_s_at), score: 0.68
CBFA2T2core-binding factor, runt domain, alpha subunit 2; translocated to, 2 (207625_s_at), score: 0.76
CDK5RAP1CDK5 regulatory subunit associated protein 1 (218315_s_at), score: 0.62
CELSR3cadherin, EGF LAG seven-pass G-type receptor 3 (flamingo homolog, Drosophila) (40020_at), score: 0.78
CHKAcholine kinase alpha (204233_s_at), score: 0.75
CIRCBF1 interacting corepressor (209571_at), score: 0.7
CLEC2BC-type lectin domain family 2, member B (209732_at), score: 0.76
CLK4CDC-like kinase 4 (210346_s_at), score: 0.62
CORO1Ccoronin, actin binding protein, 1C (221676_s_at), score: -0.78
DDAH1dimethylarginine dimethylaminohydrolase 1 (209094_at), score: -0.81
DGCR2DiGeorge syndrome critical region gene 2 (214198_s_at), score: 0.62
DGKDdiacylglycerol kinase, delta 130kDa (208072_s_at), score: 0.64
DKFZP586I1420hypothetical protein DKFZp586I1420 (213546_at), score: 0.75
DNAJC24DnaJ (Hsp40) homolog, subfamily C, member 24 (213853_at), score: 0.62
DSTYKdual serine/threonine and tyrosine protein kinase (214663_at), score: 0.65
EHD2EH-domain containing 2 (221870_at), score: -0.73
EPB41L1erythrocyte membrane protein band 4.1-like 1 (212339_at), score: 0.71
FAM102Afamily with sequence similarity 102, member A (212400_at), score: 0.62
FAM174Bfamily with sequence similarity 174, member B (51158_at), score: -0.86
FAM65Bfamily with sequence similarity 65, member B (209829_at), score: -0.75
FBXO41F-box protein 41 (44040_at), score: 0.66
FZD5frizzled homolog 5 (Drosophila) (221245_s_at), score: 0.7
GFRA1GDNF family receptor alpha 1 (205696_s_at), score: -0.74
GIT1G protein-coupled receptor kinase interacting ArfGAP 1 (218030_at), score: 0.69
GJA1gap junction protein, alpha 1, 43kDa (201667_at), score: -0.85
GPRC5BG protein-coupled receptor, family C, group 5, member B (203632_s_at), score: 0.64
GREM1gremlin 1, cysteine knot superfamily, homolog (Xenopus laevis) (218469_at), score: -1
GTF2Bgeneral transcription factor IIB (208066_s_at), score: 0.64
H1F0H1 histone family, member 0 (208886_at), score: -0.74
HEY1hairy/enhancer-of-split related with YRPW motif 1 (44783_s_at), score: 0.66
HIC2hypermethylated in cancer 2 (212964_at), score: 0.65
IFI30interferon, gamma-inducible protein 30 (201422_at), score: 0.68
IGF2BP2insulin-like growth factor 2 mRNA binding protein 2 (218847_at), score: -0.74
IL23Ainterleukin 23, alpha subunit p19 (211796_s_at), score: -0.74
IMAASLC7A5 pseudogene (208118_x_at), score: 0.72
IQCKIQ motif containing K (213392_at), score: 0.68
JAM3junctional adhesion molecule 3 (212813_at), score: -0.82
JMJD1Ajumonji domain containing 1A (212689_s_at), score: 0.65
KCTD13potassium channel tetramerisation domain containing 13 (45653_at), score: 0.69
KCTD2potassium channel tetramerisation domain containing 2 (34858_at), score: 0.62
KIF3Bkinesin family member 3B (203943_at), score: 0.7
KYNUkynureninase (L-kynurenine hydrolase) (217388_s_at), score: 0.63
L1CAML1 cell adhesion molecule (204584_at), score: -0.82
LGALS1lectin, galactoside-binding, soluble, 1 (201105_at), score: -0.74
LOC440354PI-3-kinase-related kinase SMG-1 pseudogene (210396_s_at), score: 0.64
LUMlumican (201744_s_at), score: -0.73
MAFBv-maf musculoaponeurotic fibrosarcoma oncogene homolog B (avian) (218559_s_at), score: 0.64
MAFGv-maf musculoaponeurotic fibrosarcoma oncogene homolog G (avian) (204970_s_at), score: 0.66
MAN2A2mannosidase, alpha, class 2A, member 2 (219999_at), score: 0.62
MRPS18Cmitochondrial ribosomal protein S18C (220103_s_at), score: -0.73
MTUS1mitochondrial tumor suppressor 1 (212096_s_at), score: 0.95
MYO1Bmyosin IB (212364_at), score: -0.79
NAP1L1nucleosome assembly protein 1-like 1 (208753_s_at), score: -0.73
NBEAneurobeachin (221207_s_at), score: -0.79
NCRNA00115non-protein coding RNA 115 (220399_at), score: 0.67
NRN1neuritin 1 (218625_at), score: 0.64
PAN2PAN2 poly(A) specific ribonuclease subunit homolog (S. cerevisiae) (203117_s_at), score: 0.61
PARP6poly (ADP-ribose) polymerase family, member 6 (219639_x_at), score: 0.73
PCGF2polycomb group ring finger 2 (203793_x_at), score: 0.63
PDCD2programmed cell death 2 (213581_at), score: 0.62
PDGFRAplatelet-derived growth factor receptor, alpha polypeptide (203131_at), score: -0.73
PEX5peroxisomal biogenesis factor 5 (203244_at), score: 0.71
PHF20L1PHD finger protein 20-like 1 (222133_s_at), score: 0.66
PIGNphosphatidylinositol glycan anchor biosynthesis, class N (219048_at), score: -0.74
PMS2CLPMS2 C-terminal like pseudogene (221206_at), score: 0.86
POFUT1protein O-fucosyltransferase 1 (212349_at), score: 0.66
PPARGC1Aperoxisome proliferator-activated receptor gamma, coactivator 1 alpha (219195_at), score: 0.86
PPIApeptidylprolyl isomerase A (cyclophilin A) (211378_x_at), score: -0.74
PSMD5proteasome (prosome, macropain) 26S subunit, non-ATPase, 5 (203447_at), score: -0.79
RGNEFRho-guanine nucleotide exchange factor (219610_at), score: 0.71
RIPK4receptor-interacting serine-threonine kinase 4 (221215_s_at), score: 0.64
ROBO1roundabout, axon guidance receptor, homolog 1 (Drosophila) (213194_at), score: -0.76
RSAD1radical S-adenosyl methionine domain containing 1 (218307_at), score: 0.68
S100A11S100 calcium binding protein A11 (200660_at), score: -0.83
SAP18Sin3A-associated protein, 18kDa (208740_at), score: 0.66
SAP30LSAP30-like (219129_s_at), score: 0.62
SCAND2SCAN domain containing 2 pseudogene (222177_s_at), score: 0.66
SEH1LSEH1-like (S. cerevisiae) (221931_s_at), score: -0.72
SERP1stress-associated endoplasmic reticulum protein 1 (200971_s_at), score: -0.72
SETD1ASET domain containing 1A (213202_at), score: 0.65
SIM2single-minded homolog 2 (Drosophila) (206558_at), score: 0.67
SLC24A1solute carrier family 24 (sodium/potassium/calcium exchanger), member 1 (206081_at), score: -0.74
SLC25A28solute carrier family 25, member 28 (221432_s_at), score: 0.66
SLC25A36solute carrier family 25, member 36 (201918_at), score: 0.61
SLC38A4solute carrier family 38, member 4 (220786_s_at), score: -0.75
SMA5glucuronidase, beta pseudogene (215043_s_at), score: 0.66
STAU2staufen, RNA binding protein, homolog 2 (Drosophila) (204226_at), score: -0.73
STX3syntaxin 3 (209238_at), score: 0.66
SYNGR1synaptogyrin 1 (210613_s_at), score: -0.72
SYNMsynemin, intermediate filament protein (212730_at), score: -0.73
SYT11synaptotagmin XI (209198_s_at), score: -0.72
TBXA2Rthromboxane A2 receptor (336_at), score: -0.8
TFDP2transcription factor Dp-2 (E2F dimerization partner 2) (203588_s_at), score: 0.63
THSD1thrombospondin, type I, domain containing 1 (219477_s_at), score: 0.66
TMBIM1transmembrane BAX inhibitor motif containing 1 (217730_at), score: 0.63
TMEM111transmembrane protein 111 (217882_at), score: 0.72
TMEM168transmembrane protein 168 (218962_s_at), score: -0.74
TMEM2transmembrane protein 2 (218113_at), score: -0.77
TMEM87Atransmembrane protein 87A (212202_s_at), score: 0.62
TRIM32tripartite motif-containing 32 (203846_at), score: -0.74
TRMT2ATRM2 tRNA methyltransferase 2 homolog A (S. cerevisiae) (91617_at), score: 0.65
TUBB6tubulin, beta 6 (209191_at), score: -0.76
UIMC1ubiquitin interaction motif containing 1 (220746_s_at), score: 0.68
UNC84Aunc-84 homolog A (C. elegans) (214169_at), score: 0.75
VAMP2vesicle-associated membrane protein 2 (synaptobrevin 2) (201557_at), score: 0.76
WACWW domain containing adaptor with coiled-coil (219679_s_at), score: 0.62
WASF1WAS protein family, member 1 (204165_at), score: -0.79
WASLWiskott-Aldrich syndrome-like (205809_s_at), score: 0.66
WHAMML1WAS protein homolog associated with actin, golgi membranes and microtubules-like 1 (213908_at), score: 0.66
WNT5Awingless-type MMTV integration site family, member 5A (213425_at), score: -0.72
ZNF212zinc finger protein 212 (203985_at), score: 0.72
ZNF354Azinc finger protein 354A (205427_at), score: 0.71
ZNF434zinc finger protein 434 (218937_at), score: 0.61
ZNF652zinc finger protein 652 (205594_at), score: 0.67
Non-Entrez genes
Unknown, score:
HELP
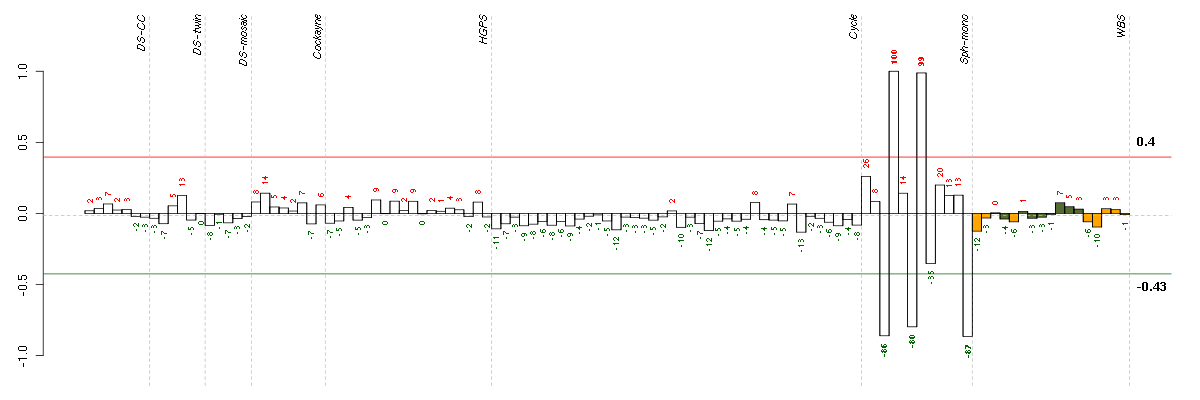
Conditions in the module, given in the same order as on the expression
plot above. Red color means over-expression, green under-expression in
the given condition.
The barplot below shows the condition (sample) scores. A separate bar
is shown for each sample, its height is the corresponding score of the
sample in the module. The red and green numbers on the bars are the
sample scores expressed in percents, i.e. 100% is 1.0.
The red and green lines show the module thresholds, samples above
the red line and below the green line are included in the module.
The different experiments that were part of the study, are separated
by dashed vertical lines.
— Click on the Help button again to close this help window.
| Id | sample | Experiment | ExpName | Array | Syndrome | Cell.line |
| E-GEOD-4219-raw-cel-1311956824.cel | 24 | 7 | Sph-mono | hgu133plus2 | none | Sph-mon 1 |
| E-GEOD-4219-raw-cel-1311956178.cel | 6 | 7 | Sph-mono | hgu133plus2 | none | Sph-mon 1 |
| E-GEOD-4219-raw-cel-1311956358.cel | 10 | 7 | Sph-mono | hgu133plus2 | none | Sph-mon 1 |
| E-GEOD-4219-raw-cel-1311956398.cel | 12 | 7 | Sph-mono | hgu133plus2 | none | Sph-mon 1 |
| E-GEOD-4219-raw-cel-1311956275.cel | 8 | 7 | Sph-mono | hgu133plus2 | none | Sph-mon 1 |


© 2008-2010 Computational Biology Group, Department of Medical Genetics,
University of Lausanne, Switzerland