Previous module |
Next module
Module #101, TG: 2.4, TC: 2.4, 97 probes, 92 Entrez genes, 5 conditions


HELP
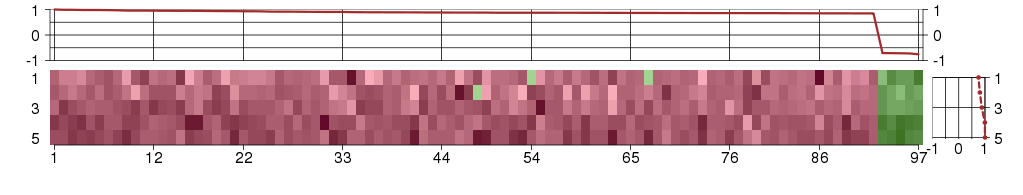
The image plot shows the color-coded level of gene expression, for the
genes and conditions in a given transcription module. The genes are on
the horizontal, the conditions on the vertical axis.
The genes are ordered according to their ISA gene scores, similarly
the conditions are ordered according to their condition scores. The
score of a gene means the «degree of inclusion» in
the module: a high score gene is essential in the module.
Condition scores can also be negative, that means that the genes of
the module are all down-regulated in the condition. Here the absolute
value of the score gives the «degree of inclusion».
The plots above and beside the expression matrix show the gene scores
and condition scores, respectively.
Note that the plot is interactive, you can see the name of the gene
and condition under the mouse cursor.
The expression matrix was normalized to have mean zero and standard
deviation one for every gene separately across all conditions
(i.e. not just for the conditions in the module).
— Click on the Help button again to close this help window.

Under-expression is coded with green,
over-expression with red color.
Help |
Hide |
Top
Help |
Show |
Top
The GO tree — Biological processes
HELP
This is one of three sections showing Gene Ontology enrichment of the
current module: in this case for biological processes.
The graph shows the hierarchy of the GO categories, their enrichment
for the current module is color coded, and the blue number beside the
category is the minus log ten p-value of the enrichment. (Calculated
using the standard hypergeometric test.) The color of the arrows code
«is a» (cyan) and «part of» relationships.
The tree was built the following way. First all GO terms with more
significant enrichment p-value than 0.05 were collected. Then all
paths from these terms to the root node of the GO tree were included
too. If a GO term is included more than once in the tree, then the
green numbers show 1) the id of the node, this makes it easier to find
other appereances of the term, and 2) the number of appearences.
Note that the same GO category might show up on the graph many
times. This is because the GO was «straightened» for this
graph, i.e. if there are more paths from a GO term to the root node of
the tree, all of them are included. The green numbers
Move the mouse cursor over the terms to get their definition. Clicking
on them takes you to the corresponding Gene Ontology web page.
If you cannot see a graph here at all, that means that there were no
significantly enriched GO categories, at the 0.05 level.
— Click on the Help button again to close this help window.
reproduction
The production by an organism of new individuals that contain some portion of their genetic material inherited from that organism.
reproductive developmental process
A developmental process by which a progressive change in the state of some part of an organism specifically contributes to its ability to form offspring.
sex differentiation
The establishment of the sex of an organism by physical differentiation.
biological_process
Any process specifically pertinent to the functioning of integrated living units: cells, tissues, organs, and organisms. A process is a collection of molecular events with a defined beginning and end.
sexual reproduction
The regular alternation, in the life cycle of haplontic, diplontic and diplohaplontic organisms, of meiosis and fertilization which provides for the production offspring. In diplontic organisms there is a life cycle in which the products of meiosis behave directly as gametes, fusing to form a zygote from which the diploid, or sexually reproductive polyploid, adult organism will develop. In diplohaplontic organisms a haploid phase (gametophyte) exists in the life cycle between meiosis and fertilization (e.g. higher plants, many algae and Fungi); the products of meiosis are spores that develop as haploid individuals from which haploid gametes develop to form a diploid zygote; diplohaplontic organisms show an alternation of haploid and diploid generations. In haplontic organisms meiosis occurs in the zygote, giving rise to four haploid cells (e.g. many algae and protozoa), only the zygote is diploid and this may form a resistant spore, tiding organisms over hard times.
reproductive process
A biological process that directly contributes to the process of producing new individuals by one or two organisms. The new individuals inherit some proportion of their genetic material from the parent or parents.
developmental process
A biological process whose specific outcome is the progression of an integrated living unit: an anatomical structure (which may be a subcellular structure, cell, tissue, or organ), or organism over time from an initial condition to a later condition.
all
NA
reproductive process
A biological process that directly contributes to the process of producing new individuals by one or two organisms. The new individuals inherit some proportion of their genetic material from the parent or parents.
reproductive developmental process
A developmental process by which a progressive change in the state of some part of an organism specifically contributes to its ability to form offspring.
Help |
Hide |
Top
Help |
Show |
Top
The GO tree — Cellular Components
HELP
This is one of three sections showing Gene Ontology enrichment of the
current module: in this case for cellular components.
The graph shows the hierarchy of the GO categories, their enrichment
for the current module is color coded, and the blue number beside the
category is the minus log ten p-value of the enrichment. (Calculated
using the standard hypergeometric test.) The color of the arrows code
«is a» (cyan) and «part of» relationships.
The tree was built the following way. First all GO terms with more
significant enrichment p-value than 0.05 were collected. Then all
paths from these terms to the root node of the GO tree were included
too. If a GO term is included more than once in the tree, then the
green numbers show 1) the id of the node, this makes it easier to find
other appereances of the term, and 2) the number of appearences.
Note that the same GO category might show up on the graph many
times. This is because the GO was «straightened» for this
graph, i.e. if there are more paths from a GO term to the root node of
the tree, all of them are included. The green numbers
Move the mouse cursor over the terms to get their definition. Clicking
on them takes you to the corresponding Gene Ontology web page.
If you cannot see a graph here at all, that means that there were no
significantly enriched GO categories, at the 0.05 level.
— Click on the Help button again to close this help window.
Help |
Hide |
Top
Help |
Show |
Top
The GO tree — Molecular Function
HELP
This is one of three sections showing Gene Ontology enrichment of the
current module: in this case for molecular function.
The graph shows the hierarchy of the GO categories, their enrichment
for the current module is color coded, and the blue number beside the
category is the minus log ten p-value of the enrichment. (Calculated
using the standard hypergeometric test.) The color of the arrows code
«is a» (cyan) and «part of» relationships.
The tree was built the following way. First all GO terms with more
significant enrichment p-value than 0.05 were collected. Then all
paths from these terms to the root node of the GO tree were included
too. If a GO term is included more than once in the tree, then the
green numbers show 1) the id of the node, this makes it easier to find
other appereances of the term, and 2) the number of appearences.
Note that the same GO category might show up on the graph many
times. This is because the GO was «straightened» for this
graph, i.e. if there are more paths from a GO term to the root node of
the tree, all of them are included. The green numbers
Move the mouse cursor over the terms to get their definition. Clicking
on them takes you to the corresponding Gene Ontology web page.
If you cannot see a graph here at all, that means that there were no
significantly enriched GO categories, at the 0.05 level.
— Click on the Help button again to close this help window.
Help |
Hide |
Top
Help |
Show |
Top
GO BP test for over-representation
HELP
List of all enriched GO categories (biological processes), at the 0.05
p-value level.
The columns:
- ExpCount is the expected count of genes in the
module annotated with the given GO term, just by chance.
- Count
is the number of genes in the module annotated with the given GO
term.
- Size is the total number of genes (in our universe)
annotated with the GO term.
Clicking on Count shows the genes that drive the
enrichment. You can also click on the individual numbers in
the Count column, to show the driving genes for that individual
GO category.
Clicking on the GO identifiers takes you to the Gene Ontology web
pages.
— Click on the Help button again to close this help window.
| Id | Pvalue | ExpCount | Count | Size | Term |
| GO:0022414 | 7.640e-04 | 3.693 | 14
BMP15, CATSPER4, CTCFL, DMRT3, DMRTB1, DMRTC2, KLF17, LHX8, NANOS2, OOEP, SPO11, TP63, ZFP42, ZPBP2 | 637 | reproductive process |
| GO:0000003 | 7.862e-04 | 3.705 | 14
BMP15, CATSPER4, CTCFL, DMRT3, DMRTB1, DMRTC2, KLF17, LHX8, NANOS2, OOEP, SPO11, TP63, ZFP42, ZPBP2 | 639 | reproduction |
| GO:0007548 | 7.284e-03 | 0.8349 | 6
DMRT3, DMRTB1, DMRTC2, LHX8, TP63, ZFP42 | 144 | sex differentiation |
| GO:0019953 | 7.362e-03 | 2.047 | 9
BMP15, CATSPER4, CTCFL, KLF17, NANOS2, OOEP, SPO11, TP63, ZPBP2 | 353 | sexual reproduction |
| GO:0042476 | 1.668e-02 | 0.3711 | 4
AQP5, FGF4, LHX8, TP63 | 64 | odontogenesis |
| GO:0007601 | 1.842e-02 | 1.038 | 6
COL2A1, GJA8, KCNV2, OPN5, PDE6A, SAG | 179 | visual perception |
| GO:0050953 | 1.842e-02 | 1.038 | 6
COL2A1, GJA8, KCNV2, OPN5, PDE6A, SAG | 179 | sensory perception of light stimulus |
| GO:0042475 | 3.066e-02 | 0.2087 | 3
FGF4, LHX8, TP63 | 36 | odontogenesis of dentine-containing tooth |
| GO:0001502 | 3.601e-02 | 0.05798 | 2
COL2A1, FGF4 | 10 | cartilage condensation |
| GO:0035107 | 3.848e-02 | 0.5044 | 4
COL2A1, FGF4, PITX1, TP63 | 87 | appendage morphogenesis |
| GO:0035108 | 3.848e-02 | 0.5044 | 4
COL2A1, FGF4, PITX1, TP63 | 87 | limb morphogenesis |
| GO:0048736 | 4.357e-02 | 0.5276 | 4
COL2A1, FGF4, PITX1, TP63 | 91 | appendage development |
| GO:0060173 | 4.357e-02 | 0.5276 | 4
COL2A1, FGF4, PITX1, TP63 | 91 | limb development |
| GO:0007276 | 4.442e-02 | 1.786 | 7
BMP15, CATSPER4, CTCFL, KLF17, NANOS2, SPO11, TP63 | 308 | gamete generation |
Help |
Hide |
Top
Help |
Show |
Top
GO CC test for over-representation
HELP
List of all enriched GO categories (cellular components), at the 0.05
p-value level.
The columns:
- ExpCount is the expected count of genes in the
module annotated with the given GO term, just by chance.
- Count
is the number of genes in the module annotated with the given GO
term.
- Size is the total number of genes (in our universe)
annotated with the GO term.
Clicking on Count shows the genes that drive the
enrichment. You can also click on the individual numbers in
the Count column, to show the driving genes for that individual
GO category.
Clicking on the GO identifiers takes you to the Gene Ontology web
pages.
— Click on the Help button again to close this help window.
Help |
Hide |
Top
Help |
Show |
Top
GO MF test for over-representation
HELP
List of all enriched GO categories (molecular function), at the 0.05
p-value level.
The columns:
- ExpCount is the expected count of genes in the
module annotated with the given GO term, just by chance.
- Count
is the number of genes in the module annotated with the given GO
term.
- Size is the total number of genes (in our universe)
annotated with the GO term.
Clicking on Count shows the genes that drive the
enrichment. You can also click on the individual numbers in
the Count column, to show the driving genes for that individual
GO category.
Clicking on the GO identifiers takes you to the Gene Ontology web
pages.
— Click on the Help button again to close this help window.
| Id | Pvalue | ExpCount | Count | Size | Term |
| GO:0003700 | 2.763e-02 | 4.399 | 12
DMBX1, DMRT3, DMRTB1, DMRTC2, ESX1, EVX1, FOXN4, KLF17, LHX8, PITX1, TP63, ZFP42 | 708 | sequence-specific DNA binding transcription factor activity |
| GO:0043565 | 4.020e-02 | 2.858 | 9
CTCFL, DMBX1, ESX1, EVX1, FOXN4, KLF17, LHX8, PITX1, TP63 | 460 | sequence-specific DNA binding |
Help |
Hide |
Top
Help |
Show |
Top
KEGG Pathway test for over-representation
HELP
List of all enriched KEGG pathways, at the 0.05
p-value level.
The columns:
- ExpCount is the expected count of genes in the
module annotated with the given KEGG pathway, just by chance.
- Count
is the number of genes in the module annotated with the given KEGG
pathway.
- Size is the total number of genes (in our universe)
annotated with the KEGG pathway.
Clicking on Count shows the genes that drive the
enrichment. You can also click on the individual numbers in
the Count column, to show the driving genes for that individual
KEGG pathway.
Clicking on the KEGG identifiers takes you to the KEGG web site.
— Click on the Help button again to close this help window.
Help |
Hide |
Top
Help |
Show |
Top
miRNA test for over-representation
HELP
List of all enriched miRNA families, at the 0.05
p-value level.
The columns:
- ExpCount is the expected count of genes in the
module regulated by the given miRNA family, just by chance.
- Count
is the number of genes in the module regulated by the given miRNA
family.
- Size is the total number of genes (in our universe)
regulated with the given miRNA family.
Clicking on Count shows the genes that drive the
enrichment. You can also click on the individual numbers in
the Count column, to show the driving genes for that individual
miRNA family.
The miRNA regulation data was taken from the TargetScan database.
(Only the conserved sites were used for the current analysis.)
Clicking on the miRNA names takes you to the TargetScan web site.
— Click on the Help button again to close this help window.
Help |
Hide |
Top
Help |
Show |
Top
Chromosome test for over-representation
HELP
List of all enriched Chromosomes, at the 0.05
p-value level.
The columns:
- ExpCount is the expected number of genes in the
module on the given chromosome, just by chance.
- Count
is the number of genes in the module on the given chromosome.
- Size is the total number of genes (in our universe)
on the given chromosome.
Clicking on Count shows the genes that drive the
enrichment. You can also click on the individual numbers in
the Count column, to show the driving genes for that individual
chromosome.
— Click on the Help button again to close this help window.
| Id | Pvalue | ExpCount | Count | Size |
| X | 1.413e-03 | 3.342 | 14
BMP15, ESX1, FAM47B, FAM9C, GLRA4, HDAC8, LOC100292575, LUZP4, MAGEA1, MAGEA4, MAGEB2, MAGEC2, PAGE1, PASD1 | 481 |
HELP
A list of all genes in the current module, in alphabetical order. The
size of the text corresponds to the gene scores.
Text color indicates correlation and anti-correlation: genes of the
same color are correlated, both move up or down in the module samples
(listed below). Genes of different color are anti-correlated, they
have opposite behavior in the module samples.
Note, that text color of the individual genes should be interpreted
together with the coloring of the samples below. For
red samples,
red genes have a higher expression
(compared to the average gene expression level),
green genes have a lower
expression.
Green samples have opposite
behavior, in these red genes have a
lower expression, green genes
have a higher expression.
Note that some gene symbols may show up more than once, if many
probes match the same Entrez gene.
Genes with no Entrez mapping are given separately, with their
Affymetrics probe ID.
— Click on the Help button again to close this help window.
Entrez genes
AANATaralkylamine N-acetyltransferase (ENSG00000129673), score: 0.85
ACTL8actin-like 8 (ENSG00000117148), score: 0.92
AQP10aquaporin 10 (ENSG00000143595), score: 0.86
AQP5aquaporin 5 (ENSG00000161798), score: 0.85
AURKCaurora kinase C (ENSG00000105146), score: 0.85
BMP15bone morphogenetic protein 15 (ENSG00000130385), score: 0.87
C11orf88chromosome 11 open reading frame 88 (ENSG00000183644), score: 0.85
C15orf60chromosome 15 open reading frame 60 (ENSG00000183324), score: 0.86
C17orf50chromosome 17 open reading frame 50 (ENSG00000154768), score: 0.89
C5orf47chromosome 5 open reading frame 47 (ENSG00000185056), score: 0.88
CAPN1calpain 1, (mu/I) large subunit (ENSG00000014216), score: -0.72
CATSPER4cation channel, sperm associated 4 (ENSG00000188782), score: 0.86
CCDC105coiled-coil domain containing 105 (ENSG00000160994), score: 0.85
CDC25Ccell division cycle 25 homolog C (S. pombe) (ENSG00000158402), score: 0.85
CDC45cell division cycle 45 homolog (S. cerevisiae) (ENSG00000093009), score: 0.86
CDCA3cell division cycle associated 3 (ENSG00000111665), score: 0.86
CHRNB4cholinergic receptor, nicotinic, beta 4 (ENSG00000117971), score: 0.86
CLSPNclaspin (ENSG00000092853), score: 0.87
COL2A1collagen, type II, alpha 1 (ENSG00000139219), score: 0.86
COMMD7COMM domain containing 7 (ENSG00000149600), score: -0.76
CTCFLCCCTC-binding factor (zinc finger protein)-like (ENSG00000124092), score: 0.86
DKFZP781G0119hypothetical protein LOC644041 (ENSG00000206043), score: 0.87
DMBX1diencephalon/mesencephalon homeobox 1 (ENSG00000197587), score: 0.89
DMRT3doublesex and mab-3 related transcription factor 3 (ENSG00000064218), score: 0.93
DMRTB1DMRT-like family B with proline-rich C-terminal, 1 (ENSG00000143006), score: 0.87
DMRTC2DMRT-like family C2 (ENSG00000142025), score: 0.87
DRG1developmentally regulated GTP binding protein 1 (ENSG00000185721), score: 0.85
ESX1ESX homeobox 1 (ENSG00000123576), score: 0.88
EVX1even-skipped homeobox 1 (ENSG00000106038), score: 0.91
FAM47Bfamily with sequence similarity 47, member B (ENSG00000189132), score: 0.85
FAM55Afamily with sequence similarity 55, member A (ENSG00000095110), score: 0.99
FAM9Cfamily with sequence similarity 9, member C (ENSG00000187268), score: 0.87
FGF4fibroblast growth factor 4 (ENSG00000075388), score: 0.95
FOXN4forkhead box N4 (ENSG00000139445), score: 0.91
G6PC2glucose-6-phosphatase, catalytic, 2 (ENSG00000152254), score: 0.96
GAB4GRB2-associated binding protein family, member 4 (ENSG00000215568), score: 0.86
GJA8gap junction protein, alpha 8, 50kDa (ENSG00000121634), score: 0.98
GLRA4glycine receptor, alpha 4 (ENSG00000188828), score: 0.88
HDAC8histone deacetylase 8 (ENSG00000147099), score: -0.71
IL13interleukin 13 (ENSG00000169194), score: 0.98
KCNV2potassium channel, subfamily V, member 2 (ENSG00000168263), score: 0.87
KLF17Kruppel-like factor 17 (ENSG00000171872), score: 0.86
KLK12kallikrein-related peptidase 12 (ENSG00000186474), score: 0.95
KLK13kallikrein-related peptidase 13 (ENSG00000167759), score: 0.99
KRT23keratin 23 (histone deacetylase inducible) (ENSG00000108244), score: 0.86
KRT26keratin 26 (ENSG00000186393), score: 0.88
LAMP3lysosomal-associated membrane protein 3 (ENSG00000078081), score: 0.94
LHX8LIM homeobox 8 (ENSG00000162624), score: 0.98
LIN28Alin-28 homolog A (C. elegans) (ENSG00000131914), score: 0.95
LOC100287738hypothetical protein LOC100287738 (ENSG00000139656), score: 0.88
LOC100292575similar to melanoma antigen family C, 2 (ENSG00000046774), score: 0.95
LOXHD1lipoxygenase homology domains 1 (ENSG00000167210), score: 0.94
LRIT1leucine-rich repeat, immunoglobulin-like and transmembrane domains 1 (ENSG00000148602), score: 1
LRRC18leucine rich repeat containing 18 (ENSG00000165383), score: 0.87
LUZP4leucine zipper protein 4 (ENSG00000102021), score: 0.89
MAGEA1melanoma antigen family A, 1 (directs expression of antigen MZ2-E) (ENSG00000198681), score: 0.95
MAGEA4melanoma antigen family A, 4 (ENSG00000147381), score: 0.92
MAGEB2melanoma antigen family B, 2 (ENSG00000099399), score: 0.91
MGLLmonoglyceride lipase (ENSG00000074416), score: -0.71
MS4A12membrane-spanning 4-domains, subfamily A, member 12 (ENSG00000071203), score: 0.87
MS4A6Emembrane-spanning 4-domains, subfamily A, member 6E (ENSG00000166926), score: 0.97
NANOS2nanos homolog 2 (Drosophila) (ENSG00000188425), score: 0.87
NLRP7NLR family, pyrin domain containing 7 (ENSG00000167634), score: 0.95
OOEPoocyte expressed protein homolog (dog) (ENSG00000203907), score: 0.87
OPN5opsin 5 (ENSG00000124818), score: 0.89
PAGE1P antigen family, member 1 (prostate associated) (ENSG00000068985), score: 0.87
PASD1PAS domain containing 1 (ENSG00000166049), score: 0.94
PDE6Aphosphodiesterase 6A, cGMP-specific, rod, alpha (ENSG00000132915), score: 0.94
PITX1paired-like homeodomain 1 (ENSG00000069011), score: 0.86
POM121L2POM121 membrane glycoprotein-like 2 (ENSG00000158553), score: 0.89
RAG2recombination activating gene 2 (ENSG00000175097), score: 0.87
RNASE11ribonuclease, RNase A family, 11 (non-active) (ENSG00000173464), score: 0.86
RNF113Bring finger protein 113B (ENSG00000139797), score: 0.91
RSPH6Aradial spoke head 6 homolog A (Chlamydomonas) (ENSG00000104941), score: 0.87
SAGS-antigen; retina and pineal gland (arrestin) (ENSG00000130561), score: 0.89
SIsucrase-isomaltase (alpha-glucosidase) (ENSG00000090402), score: 0.85
SPDYE4speedy homolog E4 (Xenopus laevis) (ENSG00000183318), score: 0.87
SPO11SPO11 meiotic protein covalently bound to DSB homolog (S. cerevisiae) (ENSG00000054796), score: 0.96
SPRR4small proline-rich protein 4 (ENSG00000184148), score: 0.96
SYCNsyncollin (ENSG00000179751), score: 0.88
TEX19testis expressed 19 (ENSG00000182459), score: 0.98
TGM4transglutaminase 4 (prostate) (ENSG00000163810), score: 0.89
TKTL2transketolase-like 2 (ENSG00000151005), score: 0.86
TP63tumor protein p63 (ENSG00000073282), score: 0.85
TPD52L3tumor protein D52-like 3 (ENSG00000170777), score: 0.88
TRIM31tripartite motif-containing 31 (ENSG00000204616), score: 0.87
WDR93WD repeat domain 93 (ENSG00000140527), score: 0.87
WFDC11WAP four-disulfide core domain 11 (ENSG00000180083), score: 0.9
ZADH2zinc binding alcohol dehydrogenase domain containing 2 (ENSG00000180011), score: -0.72
ZFP42zinc finger protein 42 homolog (mouse) (ENSG00000179059), score: 0.92
ZNF474zinc finger protein 474 (ENSG00000164185), score: 0.87
ZPBP2zona pellucida binding protein 2 (ENSG00000186075), score: 0.85
Non-Entrez genes
ENSG00000139797Unknown, score: 0.88
ENSG00000164185Unknown, score: 0.9
ENSG00000186075Unknown, score: 0.93
ENSG00000182459Unknown, score: 0.93
ENSG00000123576Unknown, score: 0.9
HELP
Conditions in the module, given in the same order as on the expression
plot above. Red color means over-expression, green under-expression in
the given condition.
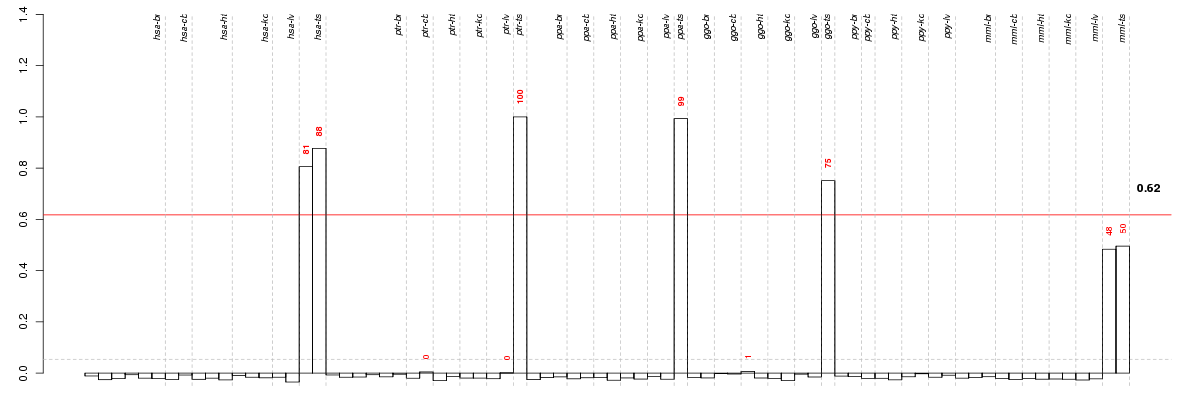
The barplot below shows the condition (sample) scores. A separate bar
is shown for each sample, its height is the corresponding score of the
sample in the module. The red and green numbers on the bars are the
sample scores expressed in percents, i.e. 100% is 1.0.
The height of each bar corresponds to the weighted
mean expression of the module genes. The weights are the gene scores
of the module and they are positive for the genes listed in
red above and they are negative for
the genes that are listed in
green.
Bars going up correspond to samples listed in
red (the ones that are different
enough to included in the module). In these samples
the red module genes are highly
expressed, and the green
module genes are lowly expressed. The behavior of the genes is the
opposite for bars going down.
The red and green lines show the module thresholds, samples above
the red line and below the green line are included in the module.
The different species and tissues that were part of the study, are separated
by dashed vertical lines.
— Click on the Help button again to close this help window.
| Id | species | tissue | sex | individual |
| ggo_ts_m_ca1 | ggo | ts | m | _ |
| hsa_ts_m1_ca1 | hsa | ts | m | 1 |
| hsa_ts_m2_ca1 | hsa | ts | m | 2 |
| ppa_ts_m_ca1 | ppa | ts | m | _ |
| ptr_ts_m_ca1 | ptr | ts | m | _ |


© 2008-2010 Computational Biology Group, Department of Medical Genetics,
University of Lausanne, Switzerland