Previous module |
Next module
Module #303, TG: 2.4, TC: 2.2, 89 probes, 89 Entrez genes, 4 conditions


HELP
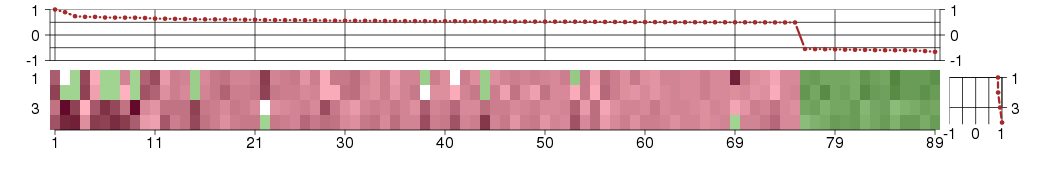
The image plot shows the color-coded level of gene expression, for the
genes and conditions in a given transcription module. The genes are on
the horizontal, the conditions on the vertical axis.
The genes are ordered according to their ISA gene scores, similarly
the conditions are ordered according to their condition scores. The
score of a gene means the «degree of inclusion» in
the module: a high score gene is essential in the module.
Condition scores can also be negative, that means that the genes of
the module are all down-regulated in the condition. Here the absolute
value of the score gives the «degree of inclusion».
The plots above and beside the expression matrix show the gene scores
and condition scores, respectively.
Note that the plot is interactive, you can see the name of the gene
and condition under the mouse cursor.
The expression matrix was normalized to have mean zero and standard
deviation one for every gene separately across all conditions
(i.e. not just for the conditions in the module).
— Click on the Help button again to close this help window.

Under-expression is coded with green,
over-expression with red color.
Help |
Hide |
Top
Help |
Show |
Top
The GO tree — Biological processes
HELP
This is one of three sections showing Gene Ontology enrichment of the
current module: in this case for biological processes.
The graph shows the hierarchy of the GO categories, their enrichment
for the current module is color coded, and the blue number beside the
category is the minus log ten p-value of the enrichment. (Calculated
using the standard hypergeometric test.) The color of the arrows code
«is a» (cyan) and «part of» relationships.
The tree was built the following way. First all GO terms with more
significant enrichment p-value than 0.05 were collected. Then all
paths from these terms to the root node of the GO tree were included
too. If a GO term is included more than once in the tree, then the
green numbers show 1) the id of the node, this makes it easier to find
other appereances of the term, and 2) the number of appearences.
Note that the same GO category might show up on the graph many
times. This is because the GO was «straightened» for this
graph, i.e. if there are more paths from a GO term to the root node of
the tree, all of them are included. The green numbers
Move the mouse cursor over the terms to get their definition. Clicking
on them takes you to the corresponding Gene Ontology web page.
If you cannot see a graph here at all, that means that there were no
significantly enriched GO categories, at the 0.05 level.
— Click on the Help button again to close this help window.
transition metal ion transport
The directed movement of transition metal ions into, out of, within or between cells by means of some external agent such as a transporter or pore. A transition metal is an element whose atom has an incomplete d-subshell of extranuclear electrons, or which gives rise to a cation or cations with an incomplete d-subshell. Transition metals often have more than one valency state. Biologically relevant transition metals include vanadium, manganese, iron, copper, cobalt, nickel, molybdenum and silver.
immune effector process
Any process of the immune system that occurs as part of an immune response.
immune system process
Any process involved in the development or functioning of the immune system, an organismal system for calibrated responses to potential internal or invasive threats.
transport
The directed movement of substances (such as macromolecules, small molecules, ions) into, out of, within or between cells, or within a multicellular organism by means of some external agent such as a transporter or pore.
ion transport
The directed movement of charged atoms or small charged molecules into, out of, within or between cells by means of some external agent such as a transporter or pore.
cation transport
The directed movement of cations, atoms or small molecules with a net positive charge, into, out of, within or between cells by means of some external agent such as a transporter or pore.
metal ion transport
The directed movement of metal ions, any metal ion with an electric charge, into, out of, within or between cells by means of some external agent such as a transporter or pore.
zinc ion transport
The directed movement of zinc (Zn) ions into, out of, within or between cells by means of some external agent such as a transporter or pore.
immune response
Any immune system process that functions in the calibrated response of an organism to a potential internal or invasive threat.
biological_process
Any process specifically pertinent to the functioning of integrated living units: cells, tissues, organs, and organisms. A process is a collection of molecular events with a defined beginning and end.
response to stimulus
A change in state or activity of a cell or an organism (in terms of movement, secretion, enzyme production, gene expression, etc.) as a result of a stimulus.
localization
Any process by which a cell, a substance, or a cellular entity, such as a protein complex or organelle, is transported to, and/or maintained in a specific location.
establishment of localization
The directed movement of a cell, substance or cellular entity, such as a protein complex or organelle, to a specific location.
all
NA
immune response
Any immune system process that functions in the calibrated response of an organism to a potential internal or invasive threat.
establishment of localization
The directed movement of a cell, substance or cellular entity, such as a protein complex or organelle, to a specific location.
immune effector process
Any process of the immune system that occurs as part of an immune response.
Help |
Hide |
Top
Help |
Show |
Top
The GO tree — Cellular Components
HELP
This is one of three sections showing Gene Ontology enrichment of the
current module: in this case for cellular components.
The graph shows the hierarchy of the GO categories, their enrichment
for the current module is color coded, and the blue number beside the
category is the minus log ten p-value of the enrichment. (Calculated
using the standard hypergeometric test.) The color of the arrows code
«is a» (cyan) and «part of» relationships.
The tree was built the following way. First all GO terms with more
significant enrichment p-value than 0.05 were collected. Then all
paths from these terms to the root node of the GO tree were included
too. If a GO term is included more than once in the tree, then the
green numbers show 1) the id of the node, this makes it easier to find
other appereances of the term, and 2) the number of appearences.
Note that the same GO category might show up on the graph many
times. This is because the GO was «straightened» for this
graph, i.e. if there are more paths from a GO term to the root node of
the tree, all of them are included. The green numbers
Move the mouse cursor over the terms to get their definition. Clicking
on them takes you to the corresponding Gene Ontology web page.
If you cannot see a graph here at all, that means that there were no
significantly enriched GO categories, at the 0.05 level.
— Click on the Help button again to close this help window.
Help |
Hide |
Top
Help |
Show |
Top
The GO tree — Molecular Function
HELP
This is one of three sections showing Gene Ontology enrichment of the
current module: in this case for molecular function.
The graph shows the hierarchy of the GO categories, their enrichment
for the current module is color coded, and the blue number beside the
category is the minus log ten p-value of the enrichment. (Calculated
using the standard hypergeometric test.) The color of the arrows code
«is a» (cyan) and «part of» relationships.
The tree was built the following way. First all GO terms with more
significant enrichment p-value than 0.05 were collected. Then all
paths from these terms to the root node of the GO tree were included
too. If a GO term is included more than once in the tree, then the
green numbers show 1) the id of the node, this makes it easier to find
other appereances of the term, and 2) the number of appearences.
Note that the same GO category might show up on the graph many
times. This is because the GO was «straightened» for this
graph, i.e. if there are more paths from a GO term to the root node of
the tree, all of them are included. The green numbers
Move the mouse cursor over the terms to get their definition. Clicking
on them takes you to the corresponding Gene Ontology web page.
If you cannot see a graph here at all, that means that there were no
significantly enriched GO categories, at the 0.05 level.
— Click on the Help button again to close this help window.
Help |
Hide |
Top
Help |
Show |
Top
GO BP test for over-representation
HELP
List of all enriched GO categories (biological processes), at the 0.05
p-value level.
The columns:
- ExpCount is the expected count of genes in the
module annotated with the given GO term, just by chance.
- Count
is the number of genes in the module annotated with the given GO
term.
- Size is the total number of genes (in our universe)
annotated with the GO term.
Clicking on Count shows the genes that drive the
enrichment. You can also click on the individual numbers in
the Count column, to show the driving genes for that individual
GO category.
Clicking on the GO identifiers takes you to the Gene Ontology web
pages.
— Click on the Help button again to close this help window.
| Id | Pvalue | ExpCount | Count | Size | Term |
| GO:0006829 | 1.877e-03 | 0.1743 | 4
SLC30A1, SLC30A10, SLC30A7, SLC39A9 | 10 | zinc ion transport |
| GO:0002252 | 3.669e-03 | 0.9588 | 7
C8B, CD28, HPX, IL12B, IL15, TLR3, VSIG4 | 55 | immune effector process |
| GO:0050776 | 1.254e-02 | 1.22 | 7
C8B, CD28, HPX, IL12B, IL15, TLR3, VSIG4 | 70 | regulation of immune response |
| GO:0050778 | 1.454e-02 | 0.8891 | 6
C8B, HPX, IL12B, IL15, TLR3, VSIG4 | 51 | positive regulation of immune response |
| GO:0006882 | 1.830e-02 | 0.03487 | 2
SLC30A1, SLC30A7 | 2 | cellular zinc ion homeostasis |
| GO:0044003 | 1.830e-02 | 0.03487 | 2
ALB, TLR3 | 2 | modification by symbiont of host morphology or physiology |
| GO:0055069 | 1.830e-02 | 0.03487 | 2
SLC30A1, SLC30A7 | 2 | zinc ion homeostasis |
| GO:0006959 | 1.990e-02 | 0.3487 | 4
C8B, CD28, HPX, VSIG4 | 20 | humoral immune response |
| GO:0002684 | 2.644e-02 | 1.429 | 7
C8B, CD28, HPX, IL12B, IL15, TLR3, VSIG4 | 82 | positive regulation of immune system process |
| GO:0002831 | 2.892e-02 | 0.1743 | 3
CD28, IL12B, IL15 | 10 | regulation of response to biotic stimulus |
| GO:0002697 | 3.395e-02 | 0.4184 | 4
CD28, HPX, IL12B, IL15 | 24 | regulation of immune effector process |
| GO:0051607 | 3.625e-02 | 0.1918 | 3
CD28, IL15, TLR3 | 11 | defense response to virus |
| GO:0045078 | 4.063e-02 | 0.0523 | 2
IL12B, TLR3 | 3 | positive regulation of interferon-gamma biosynthetic process |
| GO:0051817 | 4.063e-02 | 0.0523 | 2
ALB, TLR3 | 3 | modification of morphology or physiology of other organism involved in symbiotic interaction |
| GO:0000041 | 4.737e-02 | 0.4707 | 4
SLC30A1, SLC30A10, SLC30A7, SLC39A9 | 27 | transition metal ion transport |
| GO:0042129 | 4.737e-02 | 0.4707 | 4
CD28, IL12B, IL15, VSIG4 | 27 | regulation of T cell proliferation |
Help |
Hide |
Top
Help |
Show |
Top
GO CC test for over-representation
HELP
List of all enriched GO categories (cellular components), at the 0.05
p-value level.
The columns:
- ExpCount is the expected count of genes in the
module annotated with the given GO term, just by chance.
- Count
is the number of genes in the module annotated with the given GO
term.
- Size is the total number of genes (in our universe)
annotated with the GO term.
Clicking on Count shows the genes that drive the
enrichment. You can also click on the individual numbers in
the Count column, to show the driving genes for that individual
GO category.
Clicking on the GO identifiers takes you to the Gene Ontology web
pages.
— Click on the Help button again to close this help window.
| Id | Pvalue | ExpCount | Count | Size | Term |
| GO:0005576 | 2.506e-02 | 9.218 | 19
ALB, C8B, CA6, F10, F9, FAM20A, FETUB, GAS6, HPX, IL12B, IL15, IL22RA2, LEAP2, MMP13, PRDX4, PTPRG, SPINK4, SPP2, TWSG1 | 533 | extracellular region |
| GO:0005615 | 2.641e-02 | 3.908 | 11
ALB, C8B, GAS6, HPX, IL12B, IL15, IL22RA2, MMP13, PRDX4, PTPRG, TWSG1 | 226 | extracellular space |
Help |
Hide |
Top
Help |
Show |
Top
GO MF test for over-representation
HELP
List of all enriched GO categories (molecular function), at the 0.05
p-value level.
The columns:
- ExpCount is the expected count of genes in the
module annotated with the given GO term, just by chance.
- Count
is the number of genes in the module annotated with the given GO
term.
- Size is the total number of genes (in our universe)
annotated with the GO term.
Clicking on Count shows the genes that drive the
enrichment. You can also click on the individual numbers in
the Count column, to show the driving genes for that individual
GO category.
Clicking on the GO identifiers takes you to the Gene Ontology web
pages.
— Click on the Help button again to close this help window.
| Id | Pvalue | ExpCount | Count | Size | Term |
| GO:0004307 | 1.465e-02 | 0.03389 | 2
CEPT1, EPT1 | 2 | ethanolaminephosphotransferase activity |
| GO:0008396 | 1.465e-02 | 0.03389 | 2
CYP39A1, CYP7B1 | 2 | oxysterol 7-alpha-hydroxylase activity |
| GO:0008395 | 3.286e-02 | 0.05084 | 2
CYP39A1, CYP7B1 | 3 | steroid hydroxylase activity |
Help |
Hide |
Top
Help |
Show |
Top
KEGG Pathway test for over-representation
HELP
List of all enriched KEGG pathways, at the 0.05
p-value level.
The columns:
- ExpCount is the expected count of genes in the
module annotated with the given KEGG pathway, just by chance.
- Count
is the number of genes in the module annotated with the given KEGG
pathway.
- Size is the total number of genes (in our universe)
annotated with the KEGG pathway.
Clicking on Count shows the genes that drive the
enrichment. You can also click on the individual numbers in
the Count column, to show the driving genes for that individual
KEGG pathway.
Clicking on the KEGG identifiers takes you to the KEGG web site.
— Click on the Help button again to close this help window.
| Id | Pvalue | ExpCount | Count | Size | Term |
| 00120 | 4.828e-02 | 0.06695 | 2
CYP39A1, CYP7B1 | 3 | Primary bile acid biosynthesis |
Help |
Hide |
Top
Help |
Show |
Top
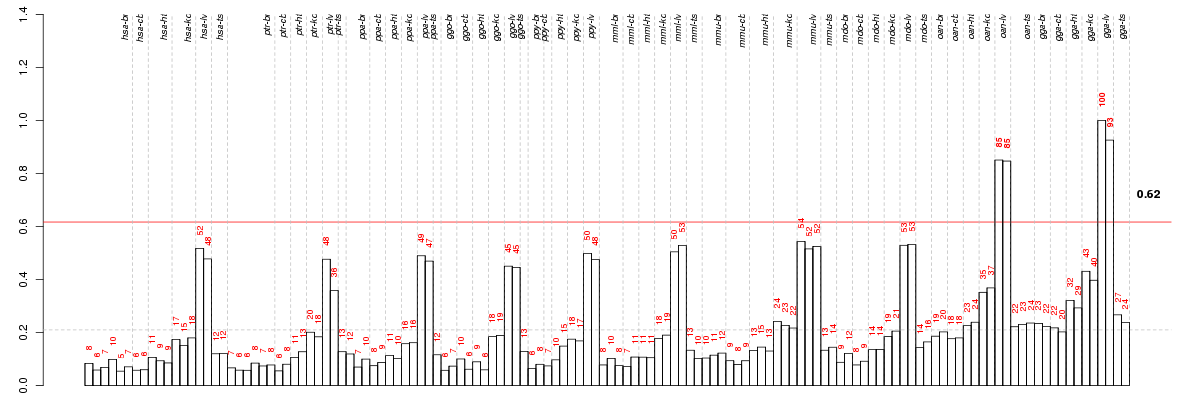
miRNA test for over-representation
HELP
List of all enriched miRNA families, at the 0.05
p-value level.
The columns:
- ExpCount is the expected count of genes in the
module regulated by the given miRNA family, just by chance.
- Count
is the number of genes in the module regulated by the given miRNA
family.
- Size is the total number of genes (in our universe)
regulated with the given miRNA family.
Clicking on Count shows the genes that drive the
enrichment. You can also click on the individual numbers in
the Count column, to show the driving genes for that individual
miRNA family.
The miRNA regulation data was taken from the TargetScan database.
(Only the conserved sites were used for the current analysis.)
Clicking on the miRNA names takes you to the TargetScan web site.
— Click on the Help button again to close this help window.
Help |
Hide |
Top
Help |
Show |
Top
Chromosome test for over-representation
HELP
List of all enriched Chromosomes, at the 0.05
p-value level.
The columns:
- ExpCount is the expected number of genes in the
module on the given chromosome, just by chance.
- Count
is the number of genes in the module on the given chromosome.
- Size is the total number of genes (in our universe)
on the given chromosome.
Clicking on Count shows the genes that drive the
enrichment. You can also click on the individual numbers in
the Count column, to show the driving genes for that individual
chromosome.
— Click on the Help button again to close this help window.
HELP
A list of all genes in the current module, in alphabetical order. The
size of the text corresponds to the gene scores.
Text color indicates correlation and anti-correlation: genes of the
same color are correlated, both move up or down in the module samples
(listed below). Genes of different color are anti-correlated, they
have opposite behavior in the module samples.
Note, that text color of the individual genes should be interpreted
together with the coloring of the samples below. For
red samples,
red genes have a higher expression
(compared to the average gene expression level),
green genes have a lower
expression.
Green samples have opposite
behavior, in these red genes have a
lower expression, green genes
have a higher expression.
Note that some gene symbols may show up more than once, if many
probes match the same Entrez gene.
Genes with no Entrez mapping are given separately, with their
Affymetrics probe ID.
— Click on the Help button again to close this help window.
Entrez genes
ABCA12ATP-binding cassette, sub-family A (ABC1), member 12 (ENSG00000144452), score: 0.68
ABHD5abhydrolase domain containing 5 (ENSG00000011198), score: 0.49
ACVR2Aactivin A receptor, type IIA (ENSG00000121989), score: 0.56
ADSLadenylosuccinate lyase (ENSG00000239900), score: 0.64
ALBalbumin (ENSG00000163631), score: 0.5
ALDH9A1aldehyde dehydrogenase 9 family, member A1 (ENSG00000143149), score: 0.61
AMDHD1amidohydrolase domain containing 1 (ENSG00000139344), score: 0.54
AP1S3adaptor-related protein complex 1, sigma 3 subunit (ENSG00000152056), score: 0.52
AP3M1adaptor-related protein complex 3, mu 1 subunit (ENSG00000185009), score: 0.55
C8Bcomplement component 8, beta polypeptide (ENSG00000021852), score: 0.5
CA6carbonic anhydrase VI (ENSG00000131686), score: 1
CAPN2calpain 2, (m/II) large subunit (ENSG00000162909), score: -0.57
CD28CD28 molecule (ENSG00000178562), score: 0.52
CEPT1choline/ethanolamine phosphotransferase 1 (ENSG00000134255), score: 0.6
CHRNA5cholinergic receptor, nicotinic, alpha 5 (ENSG00000169684), score: 0.5
CLDN1claudin 1 (ENSG00000163347), score: 0.53
CUEDC2CUE domain containing 2 (ENSG00000107874), score: -0.59
CXXC5CXXC finger 5 (ENSG00000171604), score: -0.6
CYP39A1cytochrome P450, family 39, subfamily A, polypeptide 1 (ENSG00000146233), score: 0.63
CYP7B1cytochrome P450, family 7, subfamily B, polypeptide 1 (ENSG00000172817), score: 0.54
DBR1debranching enzyme homolog 1 (S. cerevisiae) (ENSG00000138231), score: 0.55
DENND5ADENN/MADD domain containing 5A (ENSG00000184014), score: -0.61
EDEM3ER degradation enhancer, mannosidase alpha-like 3 (ENSG00000116406), score: 0.52
EPT1ethanolaminephosphotransferase 1 (CDP-ethanolamine-specific) (ENSG00000138018), score: 0.51
ERLEC1endoplasmic reticulum lectin 1 (ENSG00000068912), score: 0.55
ESR1estrogen receptor 1 (ENSG00000091831), score: 0.51
F10coagulation factor X (ENSG00000126218), score: 0.55
F9coagulation factor IX (ENSG00000101981), score: 0.56
FAF2Fas associated factor family member 2 (ENSG00000113194), score: 0.53
FAM20Afamily with sequence similarity 20, member A (ENSG00000108950), score: 0.51
FBXL20F-box and leucine-rich repeat protein 20 (ENSG00000108306), score: 0.5
FETUBfetuin B (ENSG00000090512), score: 0.58
FZD5frizzled homolog 5 (Drosophila) (ENSG00000163251), score: 0.58
GAS6growth arrest-specific 6 (ENSG00000183087), score: -0.55
GOLIM4golgi integral membrane protein 4 (ENSG00000173905), score: 0.5
HALhistidine ammonia-lyase (ENSG00000084110), score: 0.58
HPGDShematopoietic prostaglandin D synthase (ENSG00000163106), score: 0.55
HPXhemopexin (ENSG00000110169), score: 0.51
IL12Binterleukin 12B (natural killer cell stimulatory factor 2, cytotoxic lymphocyte maturation factor 2, p40) (ENSG00000113302), score: 0.68
IL15interleukin 15 (ENSG00000164136), score: 0.53
IL22RA2interleukin 22 receptor, alpha 2 (ENSG00000164485), score: 0.89
IYDiodotyrosine deiodinase (ENSG00000009765), score: 0.56
LAPTM4Blysosomal protein transmembrane 4 beta (ENSG00000104341), score: -0.6
LEAP2liver expressed antimicrobial peptide 2 (ENSG00000164406), score: 0.5
LHX8LIM homeobox 8 (ENSG00000162624), score: 0.69
LOC100292021similar to thioredoxin peroxidase (ENSG00000123131), score: 0.52
LRRC15leucine rich repeat containing 15 (ENSG00000172061), score: 0.71
LRRC31leucine rich repeat containing 31 (ENSG00000114248), score: 0.64
MAT1Amethionine adenosyltransferase I, alpha (ENSG00000151224), score: 0.49
MKLN1muskelin 1, intracellular mediator containing kelch motifs (ENSG00000128585), score: 0.61
MMP13matrix metallopeptidase 13 (collagenase 3) (ENSG00000137745), score: 0.5
MTA1metastasis associated 1 (ENSG00000182979), score: -0.63
MTTPmicrosomal triglyceride transfer protein (ENSG00000138823), score: 0.49
MUTYHmutY homolog (E. coli) (ENSG00000132781), score: 0.54
NRBP1nuclear receptor binding protein 1 (ENSG00000115216), score: -0.55
PPP2R5Dprotein phosphatase 2, regulatory subunit B', delta (ENSG00000112640), score: -0.56
PTPRGprotein tyrosine phosphatase, receptor type, G (ENSG00000144724), score: 0.51
SAR1BSAR1 homolog B (S. cerevisiae) (ENSG00000152700), score: 0.52
SDR42E1short chain dehydrogenase/reductase family 42E, member 1 (ENSG00000184860), score: 0.53
SGCEsarcoglycan, epsilon (ENSG00000127990), score: -0.66
SH3GLB2SH3-domain GRB2-like endophilin B2 (ENSG00000148341), score: -0.56
SLC26A5solute carrier family 26, member 5 (prestin) (ENSG00000170615), score: 0.62
SLC2A9solute carrier family 2 (facilitated glucose transporter), member 9 (ENSG00000109667), score: 0.5
SLC30A1solute carrier family 30 (zinc transporter), member 1 (ENSG00000170385), score: 0.58
SLC30A10solute carrier family 30, member 10 (ENSG00000196660), score: 0.5
SLC30A7solute carrier family 30 (zinc transporter), member 7 (ENSG00000162695), score: 0.54
SLC38A4solute carrier family 38, member 4 (ENSG00000139209), score: 0.52
SLC39A9solute carrier family 39 (zinc transporter), member 9 (ENSG00000029364), score: 0.51
SPINK4serine peptidase inhibitor, Kazal type 4 (ENSG00000122711), score: 0.74
SPP2secreted phosphoprotein 2, 24kDa (ENSG00000072080), score: 0.61
SRSF4serine/arginine-rich splicing factor 4 (ENSG00000116350), score: -0.6
SSR1signal sequence receptor, alpha (ENSG00000124783), score: 0.56
STOML3stomatin (EPB72)-like 3 (ENSG00000133115), score: 0.71
TAAR1trace amine associated receptor 1 (ENSG00000146399), score: 0.68
TLR3toll-like receptor 3 (ENSG00000164342), score: 0.67
TM4SF4transmembrane 4 L six family member 4 (ENSG00000169903), score: 0.56
TM7SF4transmembrane 7 superfamily member 4 (ENSG00000164935), score: 0.57
TMEM135transmembrane protein 135 (ENSG00000166575), score: 0.5
TMEM195transmembrane protein 195 (ENSG00000187546), score: 0.63
TMEM41Btransmembrane protein 41B (ENSG00000166471), score: 0.52
TRPA1transient receptor potential cation channel, subfamily A, member 1 (ENSG00000104321), score: 0.54
TTPAtocopherol (alpha) transfer protein (ENSG00000137561), score: 0.61
TWSG1twisted gastrulation homolog 1 (Drosophila) (ENSG00000128791), score: -0.58
UNC119unc-119 homolog (C. elegans) (ENSG00000109103), score: -0.58
USO1USO1 vesicle docking protein homolog (yeast) (ENSG00000138768), score: 0.6
VSIG4V-set and immunoglobulin domain containing 4 (ENSG00000155659), score: 0.5
WDFY2WD repeat and FYVE domain containing 2 (ENSG00000139668), score: 0.55
YIPF5Yip1 domain family, member 5 (ENSG00000145817), score: 0.59
ZC3H12Dzinc finger CCCH-type containing 12D (ENSG00000178199), score: 0.59
Non-Entrez genes
Unknown, score:
HELP
Conditions in the module, given in the same order as on the expression
plot above. Red color means over-expression, green under-expression in
the given condition.
The barplot below shows the condition (sample) scores. A separate bar
is shown for each sample, its height is the corresponding score of the
sample in the module. The red and green numbers on the bars are the
sample scores expressed in percents, i.e. 100% is 1.0.
The height of each bar corresponds to the weighted
mean expression of the module genes. The weights are the gene scores
of the module and they are positive for the genes listed in
red above and they are negative for
the genes that are listed in
green.
Bars going up correspond to samples listed in
red (the ones that are different
enough to included in the module). In these samples
the red module genes are highly
expressed, and the green
module genes are lowly expressed. The behavior of the genes is the
opposite for bars going down.
The red and green lines show the module thresholds, samples above
the red line and below the green line are included in the module.
The different species and tissues that were part of the study, are separated
by dashed vertical lines.
— Click on the Help button again to close this help window.
| Id | species | tissue | sex | individual |
| oan_lv_f_ca1 | oan | lv | f | _ |
| oan_lv_m_ca1 | oan | lv | m | _ |
| gga_lv_f_ca1 | gga | lv | f | _ |
| gga_lv_m_ca1 | gga | lv | m | _ |


© 2008-2010 Computational Biology Group, Department of Medical Genetics,
University of Lausanne, Switzerland