Previous module |
Next module
Module #330, TG: 2.4, TC: 1.4, 82 probes, 82 Entrez genes, 9 conditions


HELP
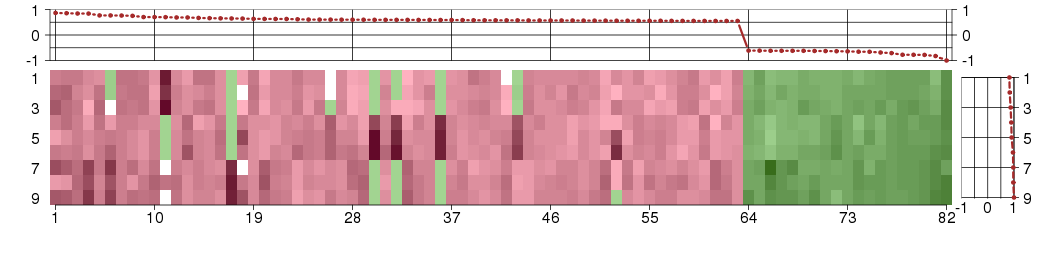
The image plot shows the color-coded level of gene expression, for the
genes and conditions in a given transcription module. The genes are on
the horizontal, the conditions on the vertical axis.
The genes are ordered according to their ISA gene scores, similarly
the conditions are ordered according to their condition scores. The
score of a gene means the «degree of inclusion» in
the module: a high score gene is essential in the module.
Condition scores can also be negative, that means that the genes of
the module are all down-regulated in the condition. Here the absolute
value of the score gives the «degree of inclusion».
The plots above and beside the expression matrix show the gene scores
and condition scores, respectively.
Note that the plot is interactive, you can see the name of the gene
and condition under the mouse cursor.
The expression matrix was normalized to have mean zero and standard
deviation one for every gene separately across all conditions
(i.e. not just for the conditions in the module).
— Click on the Help button again to close this help window.

Under-expression is coded with green,
over-expression with red color.
Help |
Hide |
Top
Help |
Show |
Top
The GO tree — Biological processes
HELP
This is one of three sections showing Gene Ontology enrichment of the
current module: in this case for biological processes.
The graph shows the hierarchy of the GO categories, their enrichment
for the current module is color coded, and the blue number beside the
category is the minus log ten p-value of the enrichment. (Calculated
using the standard hypergeometric test.) The color of the arrows code
«is a» (cyan) and «part of» relationships.
The tree was built the following way. First all GO terms with more
significant enrichment p-value than 0.05 were collected. Then all
paths from these terms to the root node of the GO tree were included
too. If a GO term is included more than once in the tree, then the
green numbers show 1) the id of the node, this makes it easier to find
other appereances of the term, and 2) the number of appearences.
Note that the same GO category might show up on the graph many
times. This is because the GO was «straightened» for this
graph, i.e. if there are more paths from a GO term to the root node of
the tree, all of them are included. The green numbers
Move the mouse cursor over the terms to get their definition. Clicking
on them takes you to the corresponding Gene Ontology web page.
If you cannot see a graph here at all, that means that there were no
significantly enriched GO categories, at the 0.05 level.
— Click on the Help button again to close this help window.
Help |
Hide |
Top
Help |
Show |
Top
The GO tree — Cellular Components
HELP
This is one of three sections showing Gene Ontology enrichment of the
current module: in this case for cellular components.
The graph shows the hierarchy of the GO categories, their enrichment
for the current module is color coded, and the blue number beside the
category is the minus log ten p-value of the enrichment. (Calculated
using the standard hypergeometric test.) The color of the arrows code
«is a» (cyan) and «part of» relationships.
The tree was built the following way. First all GO terms with more
significant enrichment p-value than 0.05 were collected. Then all
paths from these terms to the root node of the GO tree were included
too. If a GO term is included more than once in the tree, then the
green numbers show 1) the id of the node, this makes it easier to find
other appereances of the term, and 2) the number of appearences.
Note that the same GO category might show up on the graph many
times. This is because the GO was «straightened» for this
graph, i.e. if there are more paths from a GO term to the root node of
the tree, all of them are included. The green numbers
Move the mouse cursor over the terms to get their definition. Clicking
on them takes you to the corresponding Gene Ontology web page.
If you cannot see a graph here at all, that means that there were no
significantly enriched GO categories, at the 0.05 level.
— Click on the Help button again to close this help window.
Help |
Hide |
Top
Help |
Show |
Top
The GO tree — Molecular Function
HELP
This is one of three sections showing Gene Ontology enrichment of the
current module: in this case for molecular function.
The graph shows the hierarchy of the GO categories, their enrichment
for the current module is color coded, and the blue number beside the
category is the minus log ten p-value of the enrichment. (Calculated
using the standard hypergeometric test.) The color of the arrows code
«is a» (cyan) and «part of» relationships.
The tree was built the following way. First all GO terms with more
significant enrichment p-value than 0.05 were collected. Then all
paths from these terms to the root node of the GO tree were included
too. If a GO term is included more than once in the tree, then the
green numbers show 1) the id of the node, this makes it easier to find
other appereances of the term, and 2) the number of appearences.
Note that the same GO category might show up on the graph many
times. This is because the GO was «straightened» for this
graph, i.e. if there are more paths from a GO term to the root node of
the tree, all of them are included. The green numbers
Move the mouse cursor over the terms to get their definition. Clicking
on them takes you to the corresponding Gene Ontology web page.
If you cannot see a graph here at all, that means that there were no
significantly enriched GO categories, at the 0.05 level.
— Click on the Help button again to close this help window.
Help |
Hide |
Top
Help |
Show |
Top
GO BP test for over-representation
HELP
List of all enriched GO categories (biological processes), at the 0.05
p-value level.
The columns:
- ExpCount is the expected count of genes in the
module annotated with the given GO term, just by chance.
- Count
is the number of genes in the module annotated with the given GO
term.
- Size is the total number of genes (in our universe)
annotated with the GO term.
Clicking on Count shows the genes that drive the
enrichment. You can also click on the individual numbers in
the Count column, to show the driving genes for that individual
GO category.
Clicking on the GO identifiers takes you to the Gene Ontology web
pages.
— Click on the Help button again to close this help window.
| Id | Pvalue | ExpCount | Count | Size | Term |
| GO:0071214 | 4.849e-02 | 0.05615 | 2
MBIP, NEDD4 | 4 | cellular response to abiotic stimulus |
Help |
Hide |
Top
Help |
Show |
Top
GO CC test for over-representation
HELP
List of all enriched GO categories (cellular components), at the 0.05
p-value level.
The columns:
- ExpCount is the expected count of genes in the
module annotated with the given GO term, just by chance.
- Count
is the number of genes in the module annotated with the given GO
term.
- Size is the total number of genes (in our universe)
annotated with the GO term.
Clicking on Count shows the genes that drive the
enrichment. You can also click on the individual numbers in
the Count column, to show the driving genes for that individual
GO category.
Clicking on the GO identifiers takes you to the Gene Ontology web
pages.
— Click on the Help button again to close this help window.
| Id | Pvalue | ExpCount | Count | Size | Term |
| GO:0005777 | 2.660e-02 | 0.517 | 4
ABCD3, CROT, NUDT19, PEX11A | 33 | peroxisome |
| GO:0042579 | 2.660e-02 | 0.517 | 4
ABCD3, CROT, NUDT19, PEX11A | 33 | microbody |
| GO:0030684 | 3.545e-02 | 0.07833 | 2
CASP8, WDR36 | 5 | preribosome |
| GO:0044438 | 3.765e-02 | 0.282 | 3
ABCD3, CROT, PEX11A | 18 | microbody part |
| GO:0044439 | 3.765e-02 | 0.282 | 3
ABCD3, CROT, PEX11A | 18 | peroxisomal part |
| GO:0005779 | 4.787e-02 | 0.094 | 2
ABCD3, PEX11A | 6 | integral to peroxisomal membrane |
| GO:0031231 | 4.787e-02 | 0.094 | 2
ABCD3, PEX11A | 6 | intrinsic to peroxisomal membrane |
Help |
Hide |
Top
Help |
Show |
Top
GO MF test for over-representation
HELP
List of all enriched GO categories (molecular function), at the 0.05
p-value level.
The columns:
- ExpCount is the expected count of genes in the
module annotated with the given GO term, just by chance.
- Count
is the number of genes in the module annotated with the given GO
term.
- Size is the total number of genes (in our universe)
annotated with the GO term.
Clicking on Count shows the genes that drive the
enrichment. You can also click on the individual numbers in
the Count column, to show the driving genes for that individual
GO category.
Clicking on the GO identifiers takes you to the Gene Ontology web
pages.
— Click on the Help button again to close this help window.
Help |
Hide |
Top
Help |
Show |
Top
KEGG Pathway test for over-representation
HELP
List of all enriched KEGG pathways, at the 0.05
p-value level.
The columns:
- ExpCount is the expected count of genes in the
module annotated with the given KEGG pathway, just by chance.
- Count
is the number of genes in the module annotated with the given KEGG
pathway.
- Size is the total number of genes (in our universe)
annotated with the KEGG pathway.
Clicking on Count shows the genes that drive the
enrichment. You can also click on the individual numbers in
the Count column, to show the driving genes for that individual
KEGG pathway.
Clicking on the KEGG identifiers takes you to the KEGG web site.
— Click on the Help button again to close this help window.
| Id | Pvalue | ExpCount | Count | Size | Term |
| 04146 | 2.633e-02 | 0.4162 | 4
ABCD3, CROT, NUDT19, PEX11A | 30 | Peroxisome |
Help |
Hide |
Top
Help |
Show |
Top
miRNA test for over-representation
HELP
List of all enriched miRNA families, at the 0.05
p-value level.
The columns:
- ExpCount is the expected count of genes in the
module regulated by the given miRNA family, just by chance.
- Count
is the number of genes in the module regulated by the given miRNA
family.
- Size is the total number of genes (in our universe)
regulated with the given miRNA family.
Clicking on Count shows the genes that drive the
enrichment. You can also click on the individual numbers in
the Count column, to show the driving genes for that individual
miRNA family.
The miRNA regulation data was taken from the TargetScan database.
(Only the conserved sites were used for the current analysis.)
Clicking on the miRNA names takes you to the TargetScan web site.
— Click on the Help button again to close this help window.
Help |
Hide |
Top
Help |
Show |
Top
Chromosome test for over-representation
HELP
List of all enriched Chromosomes, at the 0.05
p-value level.
The columns:
- ExpCount is the expected number of genes in the
module on the given chromosome, just by chance.
- Count
is the number of genes in the module on the given chromosome.
- Size is the total number of genes (in our universe)
on the given chromosome.
Clicking on Count shows the genes that drive the
enrichment. You can also click on the individual numbers in
the Count column, to show the driving genes for that individual
chromosome.
— Click on the Help button again to close this help window.
HELP
A list of all genes in the current module, in alphabetical order. The
size of the text corresponds to the gene scores.
Text color indicates correlation and anti-correlation: genes of the
same color are correlated, both move up or down in the module samples
(listed below). Genes of different color are anti-correlated, they
have opposite behavior in the module samples.
Note, that text color of the individual genes should be interpreted
together with the coloring of the samples below. For
red samples,
red genes have a higher expression
(compared to the average gene expression level),
green genes have a lower
expression.
Green samples have opposite
behavior, in these red genes have a
lower expression, green genes
have a higher expression.
Note that some gene symbols may show up more than once, if many
probes match the same Entrez gene.
Genes with no Entrez mapping are given separately, with their
Affymetrics probe ID.
— Click on the Help button again to close this help window.
Entrez genes
A4GNTalpha-1,4-N-acetylglucosaminyltransferase (ENSG00000118017), score: 0.6
ABCD3ATP-binding cassette, sub-family D (ALD), member 3 (ENSG00000117528), score: 0.7
ARFGEF1ADP-ribosylation factor guanine nucleotide-exchange factor 1(brefeldin A-inhibited) (ENSG00000066777), score: 0.6
B4GALT2UDP-Gal:betaGlcNAc beta 1,4- galactosyltransferase, polypeptide 2 (ENSG00000117411), score: -0.83
BBS2Bardet-Biedl syndrome 2 (ENSG00000125124), score: -0.62
BCL10B-cell CLL/lymphoma 10 (ENSG00000142867), score: 0.56
BPNT13'(2'), 5'-bisphosphate nucleotidase 1 (ENSG00000162813), score: 0.6
C12orf72chromosome 12 open reading frame 72 (ENSG00000139160), score: 0.55
C1orf91chromosome 1 open reading frame 91 (ENSG00000160055), score: 0.63
C7orf23chromosome 7 open reading frame 23 (ENSG00000135185), score: 0.59
CASP8caspase 8, apoptosis-related cysteine peptidase (ENSG00000064012), score: 0.56
CCBL2cysteine conjugate-beta lyase 2 (ENSG00000137944), score: 0.56
CCDC92coiled-coil domain containing 92 (ENSG00000119242), score: -0.69
CCRL1chemokine (C-C motif) receptor-like 1 (ENSG00000129048), score: 0.84
CDK8cyclin-dependent kinase 8 (ENSG00000132964), score: 0.85
CHUKconserved helix-loop-helix ubiquitous kinase (ENSG00000213341), score: 0.57
CNR2cannabinoid receptor 2 (macrophage) (ENSG00000188822), score: 0.84
COL10A1collagen, type X, alpha 1 (ENSG00000123500), score: 0.64
COPB2coatomer protein complex, subunit beta 2 (beta prime) (ENSG00000184432), score: 0.56
CROTcarnitine O-octanoyltransferase (ENSG00000005469), score: 0.6
DIMT1LDIM1 dimethyladenosine transferase 1-like (S. cerevisiae) (ENSG00000086189), score: -0.63
ELK4ELK4, ETS-domain protein (SRF accessory protein 1) (ENSG00000158711), score: 0.57
ENTPD4ectonucleoside triphosphate diphosphohydrolase 4 (ENSG00000197217), score: 0.62
ETFDHelectron-transferring-flavoprotein dehydrogenase (ENSG00000171503), score: 0.55
FABP2fatty acid binding protein 2, intestinal (ENSG00000145384), score: 0.65
FARS2phenylalanyl-tRNA synthetase 2, mitochondrial (ENSG00000145982), score: 0.55
GBA2glucosidase, beta (bile acid) 2 (ENSG00000070610), score: -0.64
GPR180G protein-coupled receptor 180 (ENSG00000152749), score: 0.63
H1FXH1 histone family, member X (ENSG00000184897), score: -1
HELBhelicase (DNA) B (ENSG00000127311), score: 0.57
HNRNPRheterogeneous nuclear ribonucleoprotein R (ENSG00000125944), score: -0.62
IFFO1intermediate filament family orphan 1 (ENSG00000010295), score: -0.66
KIAA0100KIAA0100 (ENSG00000007202), score: 0.57
LARP4BLa ribonucleoprotein domain family, member 4B (ENSG00000107929), score: 0.56
LCLAT1lysocardiolipin acyltransferase 1 (ENSG00000172954), score: 0.66
LIFRleukemia inhibitory factor receptor alpha (ENSG00000113594), score: 0.63
LRTM1leucine-rich repeats and transmembrane domains 1 (ENSG00000144771), score: 0.7
MAP1Dmethionine aminopeptidase 1D (ENSG00000172878), score: 0.67
MARCH5membrane-associated ring finger (C3HC4) 5 (ENSG00000198060), score: 0.69
MBIPMAP3K12 binding inhibitory protein 1 (ENSG00000151332), score: -0.62
MCCC1methylcrotonoyl-CoA carboxylase 1 (alpha) (ENSG00000078070), score: 0.56
MEAF6MYST/Esa1-associated factor 6 (ENSG00000163875), score: -0.78
MED28mediator complex subunit 28 (ENSG00000118579), score: 0.59
MEP1Ameprin A, alpha (PABA peptide hydrolase) (ENSG00000112818), score: 0.59
MEP1Bmeprin A, beta (ENSG00000141434), score: 0.59
MIPOL1mirror-image polydactyly 1 (ENSG00000151338), score: 0.59
MMP13matrix metallopeptidase 13 (collagenase 3) (ENSG00000137745), score: 0.56
NECAB3N-terminal EF-hand calcium binding protein 3 (ENSG00000125967), score: -0.71
NEDD4neural precursor cell expressed, developmentally down-regulated 4 (ENSG00000069869), score: 0.76
NSL1NSL1, MIND kinetochore complex component, homolog (S. cerevisiae) (ENSG00000117697), score: -0.77
NUDT19nudix (nucleoside diphosphate linked moiety X)-type motif 19 (ENSG00000213965), score: 0.69
OXNAD1oxidoreductase NAD-binding domain containing 1 (ENSG00000154814), score: 0.58
PEX11Aperoxisomal biogenesis factor 11 alpha (ENSG00000166821), score: 0.55
PPP2R5Aprotein phosphatase 2, regulatory subunit B', alpha (ENSG00000066027), score: 0.58
PRKD3protein kinase D3 (ENSG00000115825), score: 0.6
PSMA4proteasome (prosome, macropain) subunit, alpha type, 4 (ENSG00000041357), score: 0.55
PSMD12proteasome (prosome, macropain) 26S subunit, non-ATPase, 12 (ENSG00000197170), score: 0.57
PSTPIP2proline-serine-threonine phosphatase interacting protein 2 (ENSG00000152229), score: 0.55
PTGR2prostaglandin reductase 2 (ENSG00000140043), score: 0.58
RNF139ring finger protein 139 (ENSG00000170881), score: 0.63
SAP30BPSAP30 binding protein (ENSG00000161526), score: -0.62
SERINC3serine incorporator 3 (ENSG00000132824), score: 0.6
SFMBT2Scm-like with four mbt domains 2 (ENSG00000198879), score: -0.64
SGSM3small G protein signaling modulator 3 (ENSG00000100359), score: -0.66
SLC18A1solute carrier family 18 (vesicular monoamine), member 1 (ENSG00000036565), score: 0.57
SLC25A16solute carrier family 25 (mitochondrial carrier; Graves disease autoantigen), member 16 (ENSG00000122912), score: 0.56
SLC39A6solute carrier family 39 (zinc transporter), member 6 (ENSG00000141424), score: -0.63
SMARCA1SWI/SNF related, matrix associated, actin dependent regulator of chromatin, subfamily a, member 1 (ENSG00000102038), score: -0.78
SSPNsarcospan (Kras oncogene-associated gene) (ENSG00000123096), score: 0.75
TCP11L1t-complex 11 (mouse)-like 1 (ENSG00000176148), score: -0.61
TECtec protein tyrosine kinase (ENSG00000135605), score: 0.57
TMBIM4transmembrane BAX inhibitor motif containing 4 (ENSG00000155957), score: 0.55
TMEM106Btransmembrane protein 106B (ENSG00000106460), score: 0.59
TMEM64transmembrane protein 64 (ENSG00000180694), score: 0.61
TXNDC9thioredoxin domain containing 9 (ENSG00000115514), score: 0.58
UBR2ubiquitin protein ligase E3 component n-recognin 2 (ENSG00000024048), score: 0.7
UBTD2ubiquitin domain containing 2 (ENSG00000168246), score: -0.61
WDR36WD repeat domain 36 (ENSG00000134987), score: 0.59
WDR89WD repeat domain 89 (ENSG00000140006), score: 0.77
ZBTB41zinc finger and BTB domain containing 41 (ENSG00000177888), score: 0.65
ZC3H7Azinc finger CCCH-type containing 7A (ENSG00000122299), score: 0.87
ZNF750zinc finger protein 750 (ENSG00000141579), score: 0.77
Non-Entrez genes
Unknown, score:
HELP
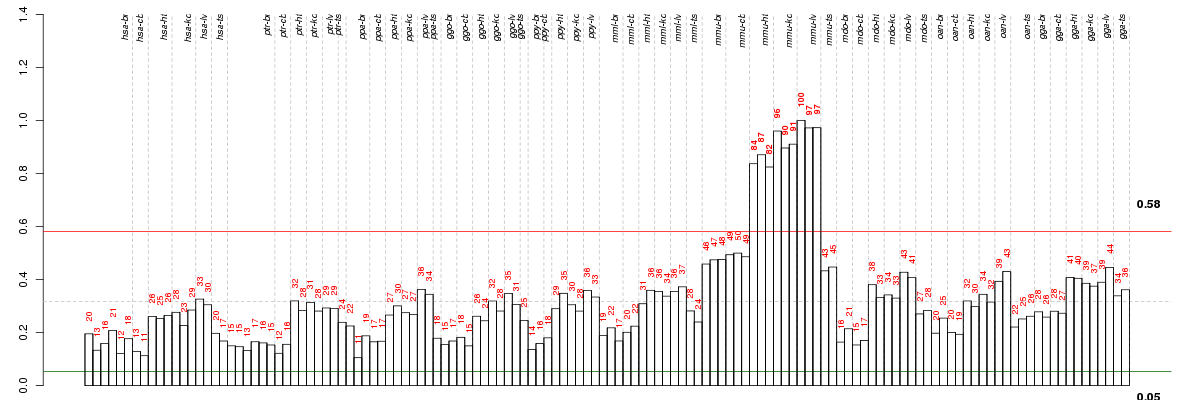
Conditions in the module, given in the same order as on the expression
plot above. Red color means over-expression, green under-expression in
the given condition.
The barplot below shows the condition (sample) scores. A separate bar
is shown for each sample, its height is the corresponding score of the
sample in the module. The red and green numbers on the bars are the
sample scores expressed in percents, i.e. 100% is 1.0.
The height of each bar corresponds to the weighted
mean expression of the module genes. The weights are the gene scores
of the module and they are positive for the genes listed in
red above and they are negative for
the genes that are listed in
green.
Bars going up correspond to samples listed in
red (the ones that are different
enough to included in the module). In these samples
the red module genes are highly
expressed, and the green
module genes are lowly expressed. The behavior of the genes is the
opposite for bars going down.
The red and green lines show the module thresholds, samples above
the red line and below the green line are included in the module.
The different species and tissues that were part of the study, are separated
by dashed vertical lines.
— Click on the Help button again to close this help window.
| Id | species | tissue | sex | individual |
| mmu_ht_f_ca1 | mmu | ht | f | _ |
| mmu_ht_m2_ca1 | mmu | ht | m | 2 |
| mmu_ht_m1_ca1 | mmu | ht | m | 1 |
| mmu_kd_m2_ca1 | mmu | kd | m | 2 |
| mmu_kd_f_ca1 | mmu | kd | f | _ |
| mmu_kd_m1_ca1 | mmu | kd | m | 1 |
| mmu_lv_m1_ca1 | mmu | lv | m | 1 |
| mmu_lv_f_ca1 | mmu | lv | f | _ |
| mmu_lv_m2_ca1 | mmu | lv | m | 2 |


© 2008-2010 Computational Biology Group, Department of Medical Genetics,
University of Lausanne, Switzerland