File list
This special page shows all uploaded files.
First page |
Previous page |
Next page |
Last page |
| Date | Name | Thumbnail | Size | User | Description | Versions |
|---|---|---|---|---|---|---|
| 19:09, 14 December 2015 | Slides Dec14.pptx (file) | 86 KB | GiovanniCiriello | 1 | ||
| 19:06, 14 December 2015 | Data and code 14.12.15.zip (file) | 5.97 MB | GiovanniCiriello | 1 | ||
| 19:28, 13 December 2015 | Data and code.zip (file) | 20 KB | GiovanniCiriello | 1 | ||
| 18:59, 8 December 2015 | Slides Tue.Dec8.pptx (file) | 9.63 MB | GiovanniCiriello | 1 | ||
| 16:18, 5 November 2015 | CBG picture 2015.png (file) |  |
3.35 MB | Sven | 2 | |
| 11:27, 5 November 2015 | Module2.zip (file) | 12.85 MB | DavidGfeller2 | 1 | ||
| 10:44, 3 November 2015 | ProcessedMicroarrayData.txt.zip (file) | 5.86 MB | Sven | 1 | ||
| 14:41, 2 November 2015 | Danio age index.txt.zip (file) | 110 KB | Sven | 1 | ||
| 16:47, 26 October 2015 | Module2 Gfeller course.zip (file) | 12.62 MB | DavidGfeller2 | Module 2 - Gfeller - new version | 1 | |
| 16:11, 26 October 2015 | Module2 Gfeller.zip (file) | 12.62 MB | DavidGfeller2 | 1 | ||
| 16:02, 26 October 2015 | Data Gfeller Modlue2.zip (file) | 12.62 MB | DavidGfeller2 | Data | 1 | |
| 15:53, 26 October 2015 | Data Gfeller Module2.zip (file) | 12.62 MB | DavidGfeller2 | Cases in Bioinformatics - Module 2 - David Gfeller | 1 | |
| 15:44, 26 October 2015 | Data Gfeller.zip (file) | 12.62 MB | DavidGfeller2 | Data for the Course 'Case studies in Bioinformatics' - Module 2 - David Gfeller | 1 | |
| 15:25, 26 October 2015 | Data.zip (file) | 12.62 MB | DavidGfeller2 | Course Material for Module 2 of Case studies in Bioinformatics - Gfeller | 1 | |
| 16:01, 11 September 2015 | PASCAL.zip (file) | 162 bytes | Micha | empty placeholder | 2 | |
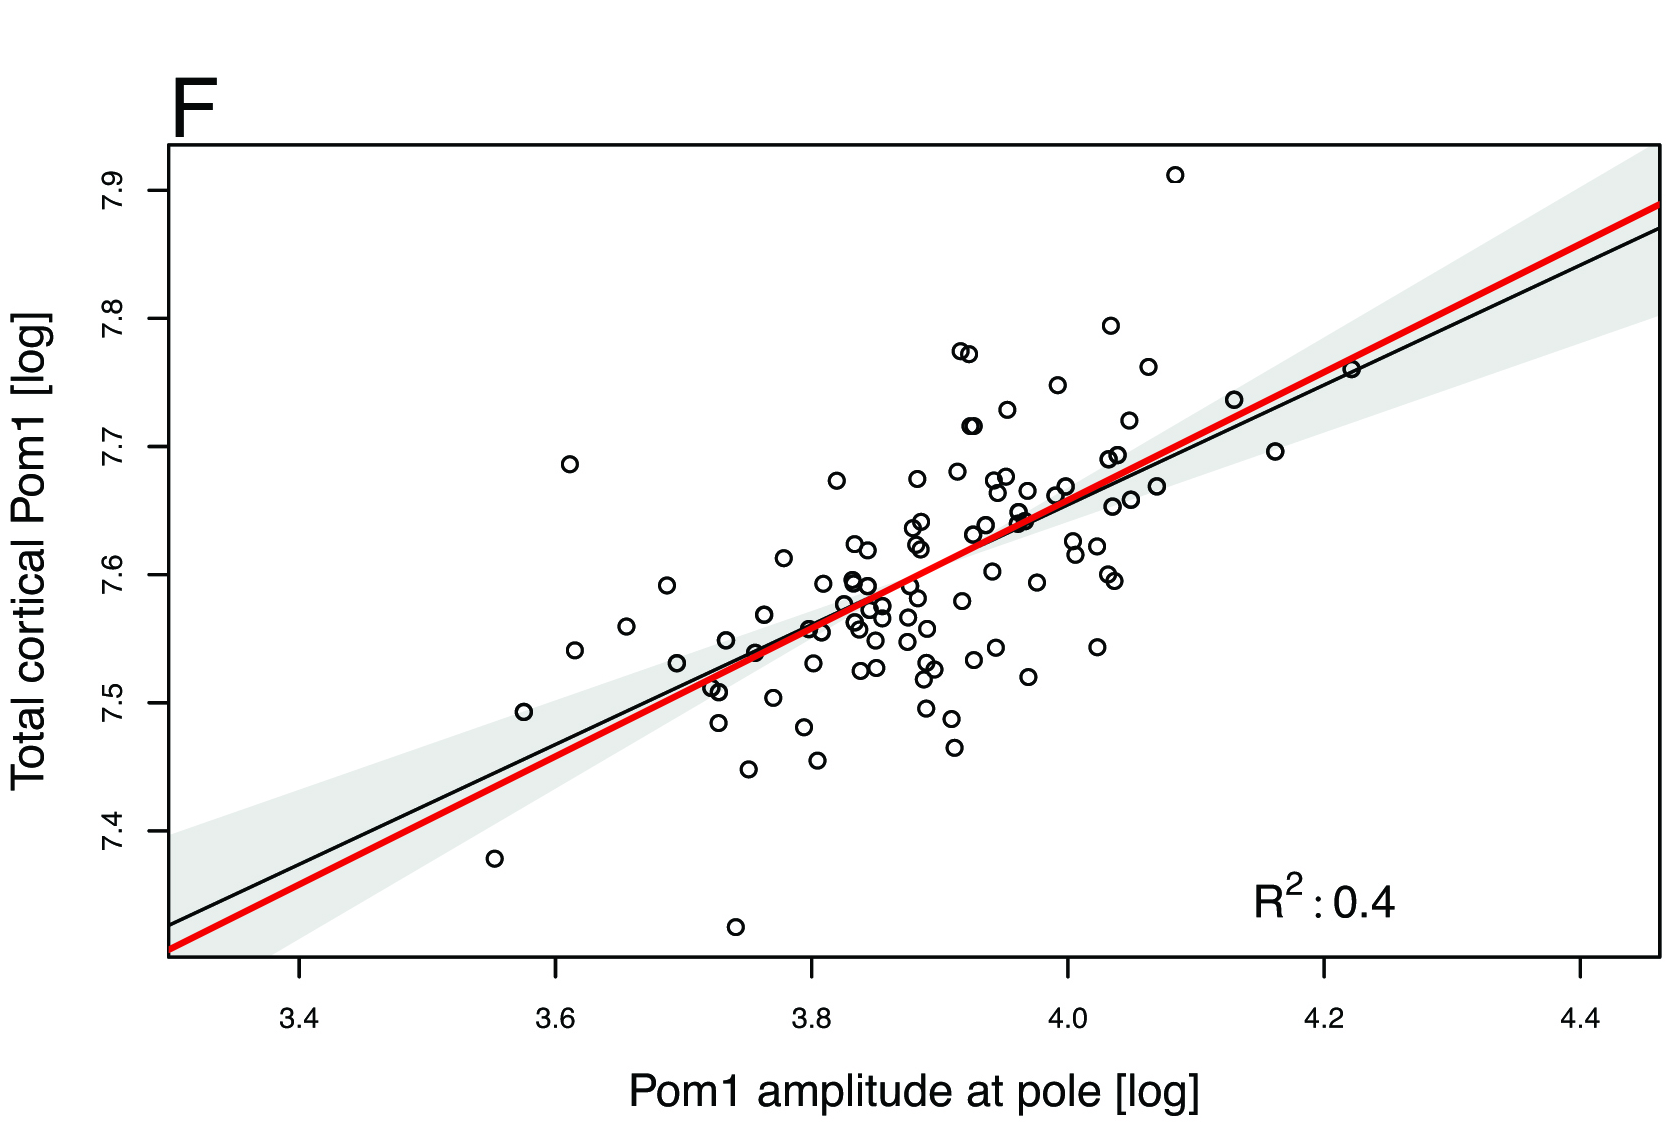
| 17:08, 14 July 2015 | Pom1 cortical.png (file) |  |
299 KB | Micha | 1 | |
| 16:52, 14 July 2015 | Pom1 power laws.png (file) |  |
164 KB | Micha | 1 | |
| 16:41, 14 July 2015 | Power gradient.png (file) |  |
68 KB | Micha | 1 | |
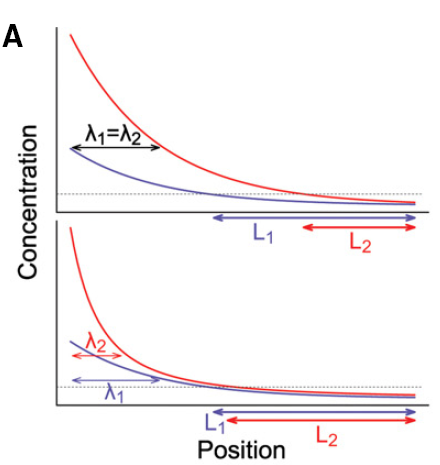
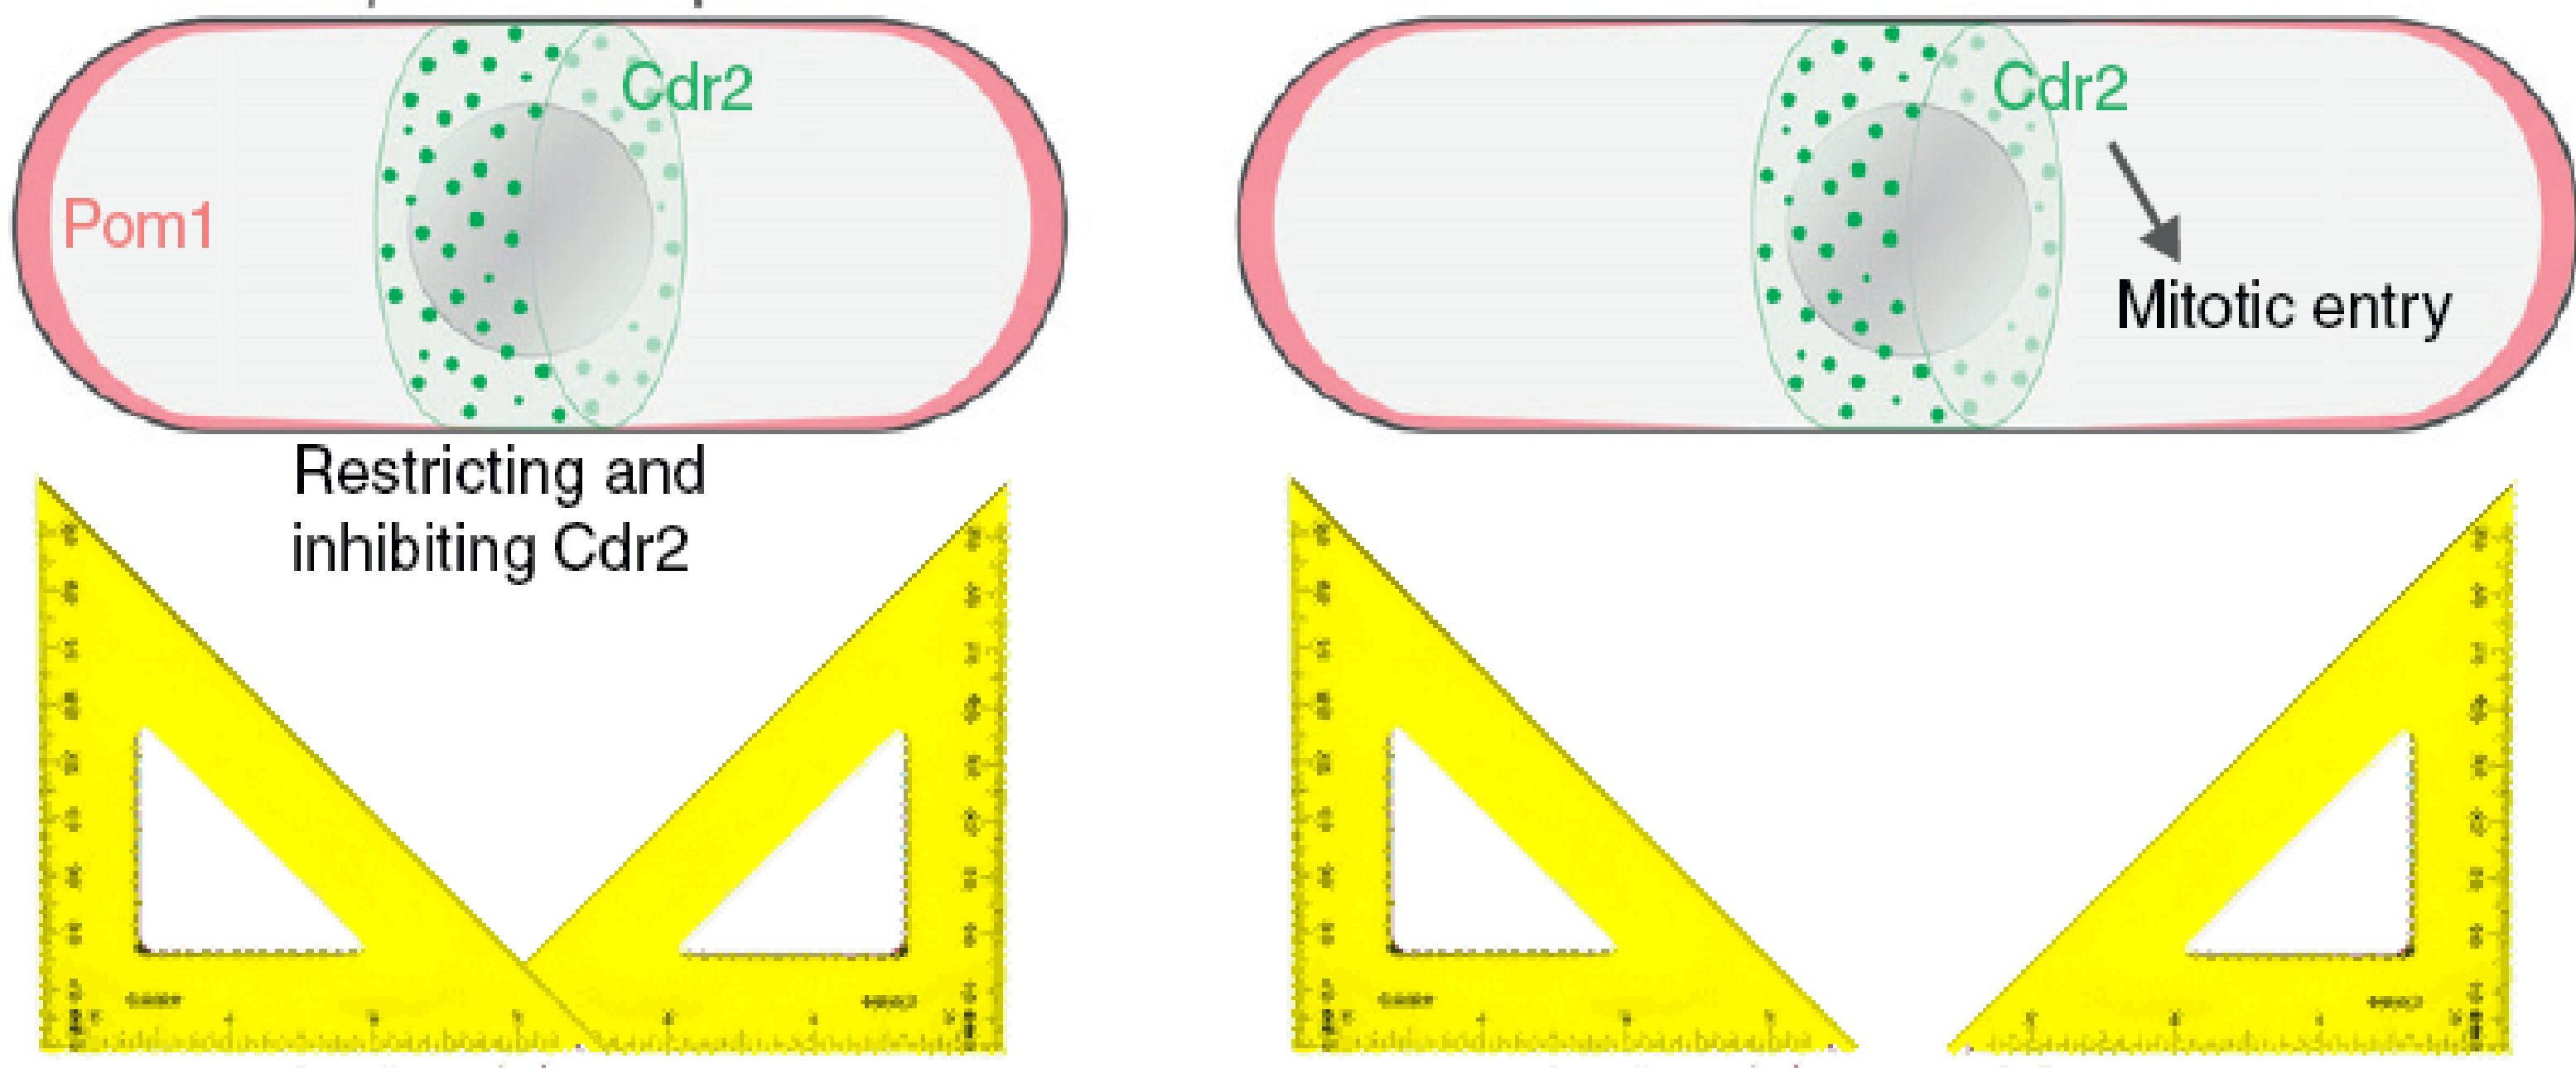
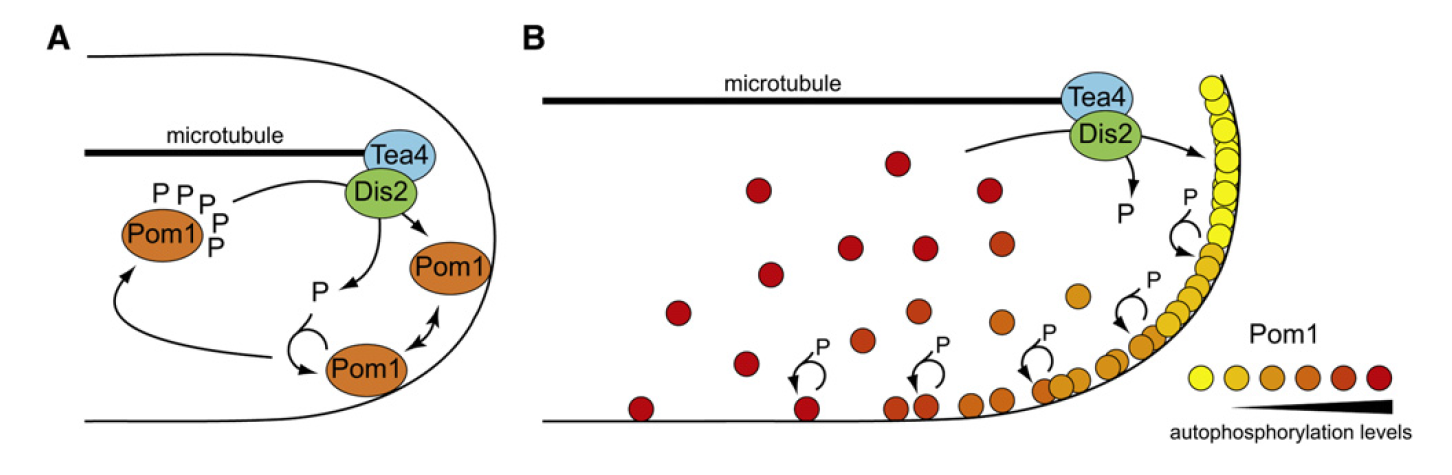
| 16:30, 14 July 2015 | Pombe pom1 gradient model.png (file) |  |
180 KB | Micha | 1 | |
| 17:54, 16 June 2015 | CholColausOnlyPval 1500subset1.txt.zip (file) | 17.3 MB | David | 1 | ||
| 17:54, 16 June 2015 | CholColausOnlyPval 1500subset2.txt.zip (file) | 17.3 MB | David | 1 | ||
| 17:54, 16 June 2015 | CholColausOnlyPval 1500subset3.txt.zip (file) | 17.3 MB | David | 1 | ||
| 17:52, 16 June 2015 | HdlColausOnlyPval 1500subset1.txt.zip (file) | 17.3 MB | David | 1 | ||
| 17:52, 16 June 2015 | HdlColausOnlyPval 1500subset2.txt.zip (file) | 17.3 MB | David | 1 | ||
| 17:52, 16 June 2015 | HdlColausOnlyPval 1500subset3.txt.zip (file) | 17.3 MB | David | 1 | ||
| 17:51, 16 June 2015 | LdlColausOnlyPval 1500subset1.txt.zip (file) | 17.3 MB | David | 1 | ||
| 17:50, 16 June 2015 | LdlColausOnlyPval 1500subset2.txt.zip (file) | 17.29 MB | David | 1 | ||
| 17:49, 16 June 2015 | LdlColausOnlyPval 1500subset3.txt.zip (file) | 17.3 MB | David | 1 | ||
| 17:46, 16 June 2015 | TRIGColausOnlyPval 1500subset1.txt.zip (file) | 17.3 MB | David | 1 | ||
| 17:46, 16 June 2015 | TRIGColausOnlyPval 1500subset2.txt.zip (file) | 17.3 MB | David | 1 | ||
| 17:45, 16 June 2015 | TRIGColausOnlyPval 1500subset3.txt.zip (file) | 17.31 MB | David | 1 | ||
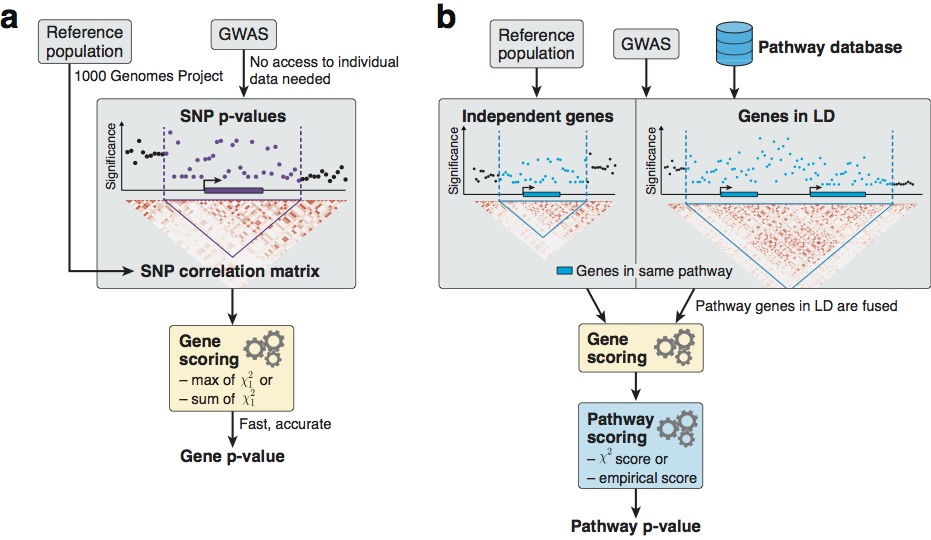
| 15:38, 15 June 2015 | PascalFigure1.jpg (file) |  |
112 KB | David | 1 | |
| 15:35, 15 June 2015 | PascalFigure1.pdf (file) | 1.56 MB | David | 1 | ||
| 14:18, 29 May 2015 | Wikipage finale.pdf (file) | 602 KB | Sbprm2015 7 | 2 | ||
| 11:06, 29 May 2015 | Présentation finale.pptx (file) | 928 KB | Sbprm2015 4 | 1 | ||
| 11:01, 29 May 2015 | Tab.png (file) | 4 KB | Sbprm2015 4 | 1 | ||
| 10:57, 29 May 2015 | Resultats.png (file) |  |
6 KB | Sbprm2015 4 | 1 | |
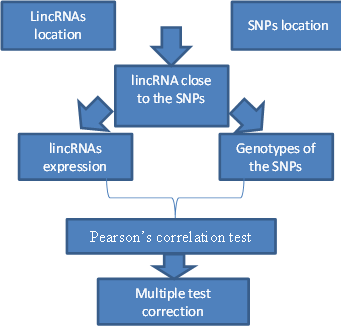
| 10:49, 29 May 2015 | Methodolgy.png (file) |  |
12 KB | Sbprm2015 4 | 2 | |
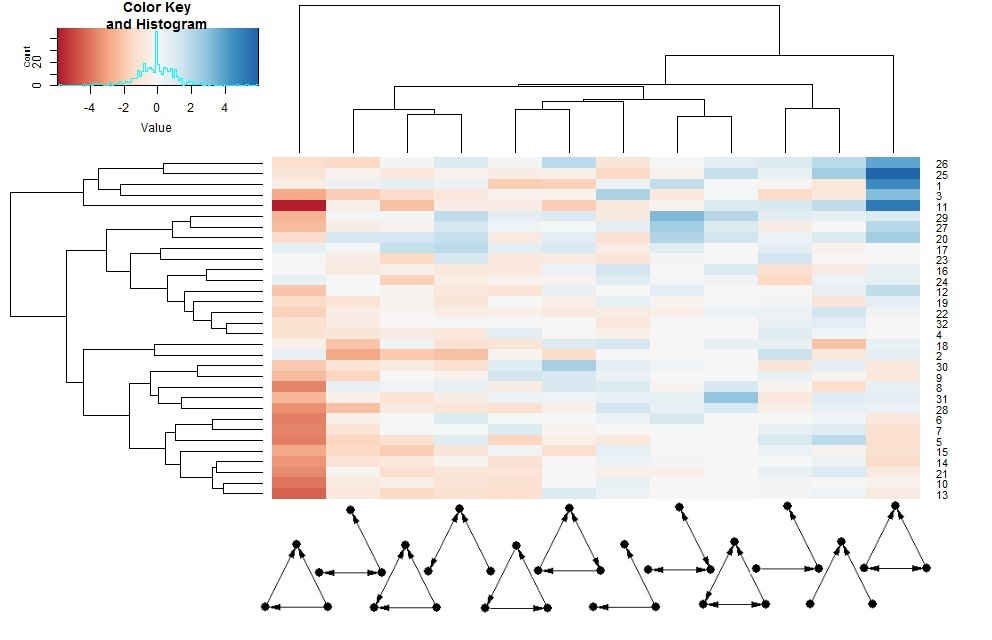
| 10:16, 29 May 2015 | Image4.png (file) |  |
186 KB | Sbprm2015 3 | Figure 4: On x axis are all 12 three knots’ motifs and in y axis are all 32 true networks. This heatmap shows the z-score of each motifs for each cluster | 3 |
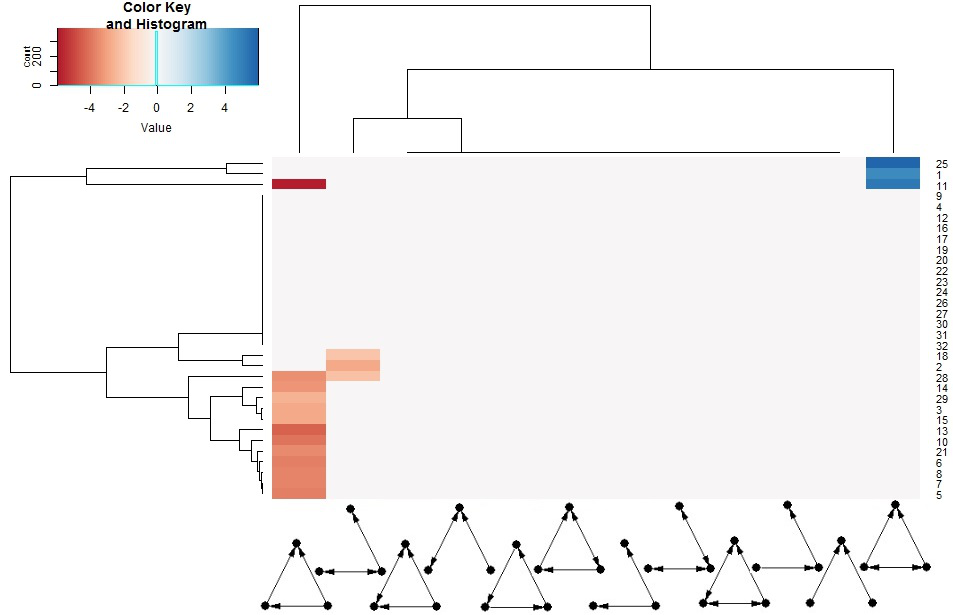
| 10:15, 29 May 2015 | Image5.png (file) |  |
97 KB | Sbprm2015 3 | Figure 5: On x axis are all 12 three knots’ motifs and in y axis are all 32 true networks. This heatmap shows the z-score of each motifs for each cluster that had a significant p-value after a benjamini hochberg correction for multiple testing. | 1 |
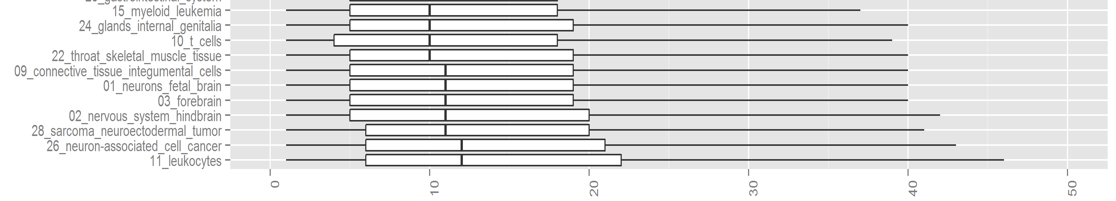
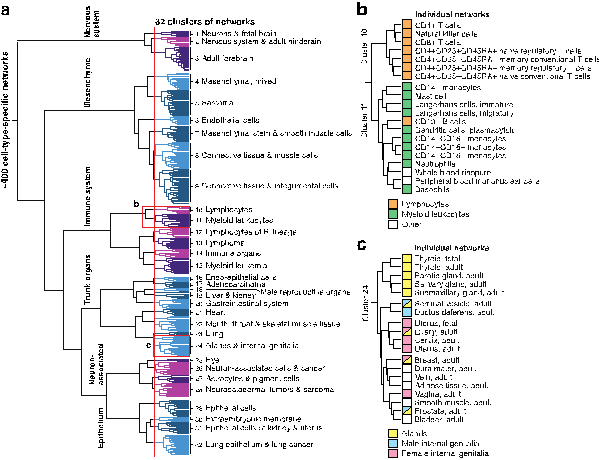
| 10:14, 29 May 2015 | Image3.png (file) | 50 KB | Sbprm2015 3 | Figure 3: Zoom on nervous and immune cells | 1 | |
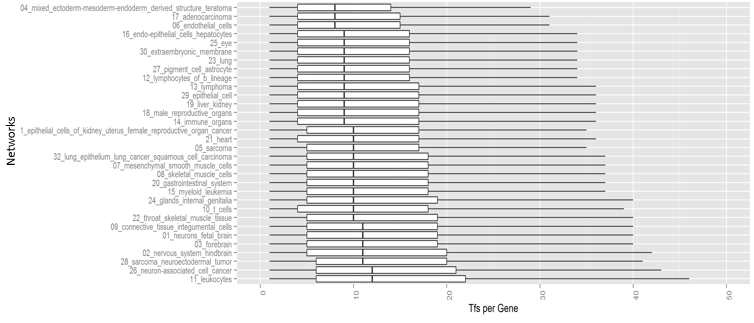
| 10:13, 29 May 2015 | Image2.png (file) |  |
74 KB | Sbprm2015 3 | Figure 2: Number of transcription factors per gene for each network | 1 |
| 10:10, 29 May 2015 | Image1.png (file) |  |
20 KB | Sbprm2015 3 | Figure 1: This image that was taken from Daniel Marbach et al. paper shows the 400 original networks that were regrouped in 32 clusters by Daniel Marbach. | 5 |
| 18:29, 28 May 2015 | Prioritizing genes via network enrichment.pdf (file) | 875 KB | Sbprm2015 5 | 2 | ||
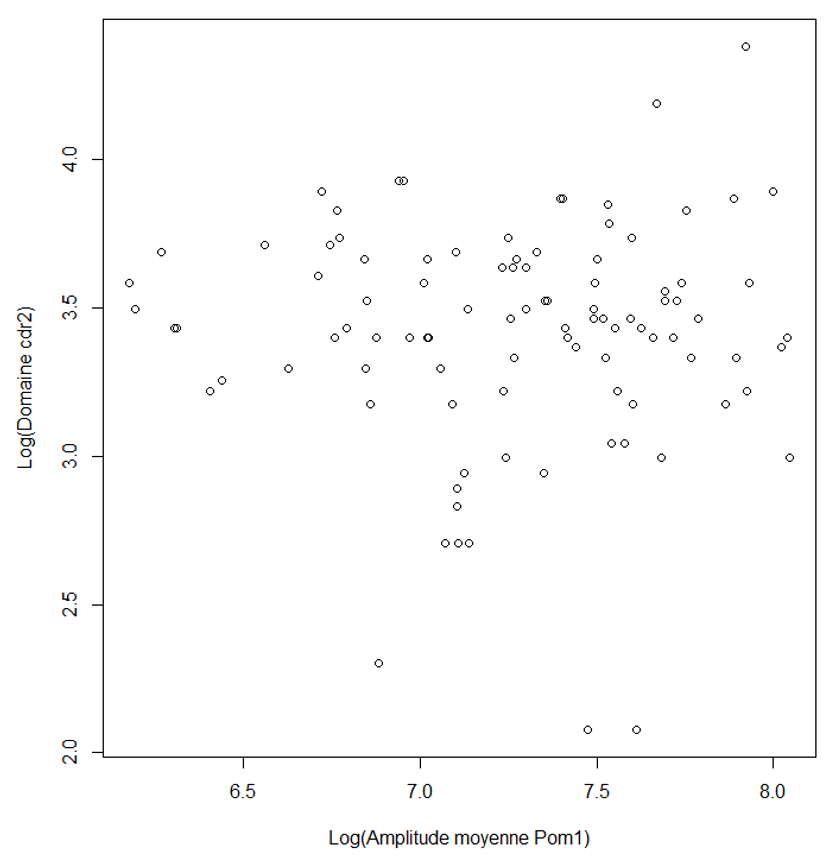
| 13:50, 28 May 2015 | GrapheCdr2Pom1.png (file) |  |
49 KB | Sbprm2015 1 | 2 | |
| 13:49, 28 May 2015 | Gradient .png (file) |  |
261 KB | Sbprm2015 1 | 2 | |
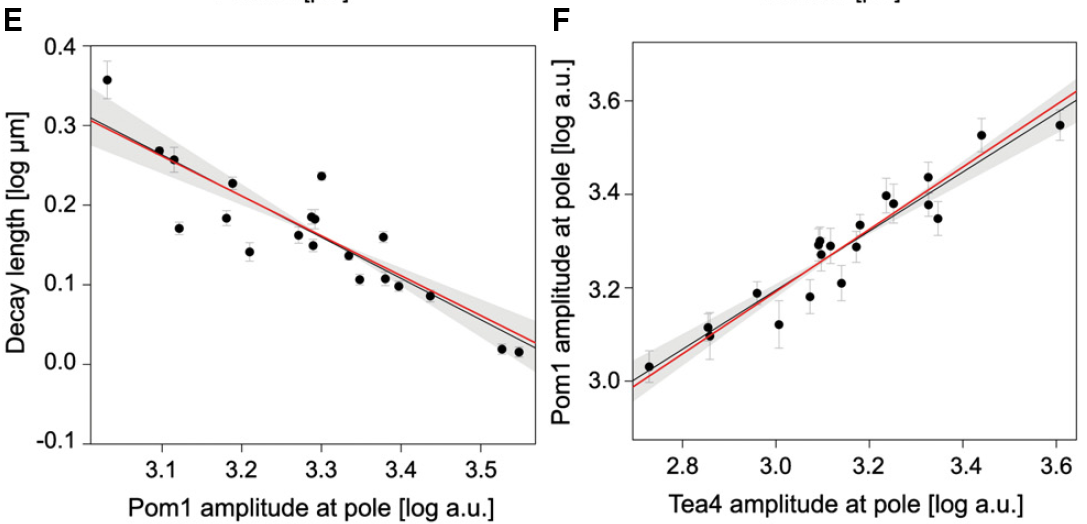
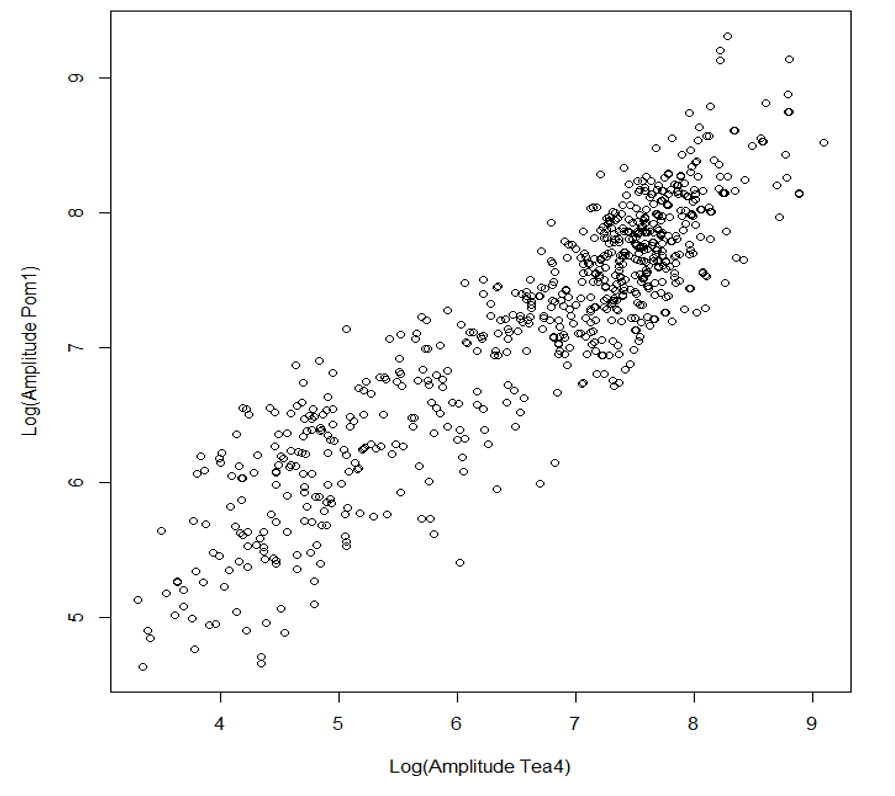
| 12:03, 28 May 2015 | GrapheTea4Pom1.png (file) |  |
115 KB | Sbprm2015 1 | 1 | |
| 12:02, 28 May 2015 | Tea4Pom1.png (file) |  |
97 KB | Sbprm2015 1 | 1 | |
| 13:04, 25 May 2015 | Genetics of Menopause.pdf (file) | 744 KB | Sbprm2015 2 | 2 | ||
| 12:28, 25 May 2015 | Wiki summaryPDF.pdf (file) | 491 KB | Sbprm2015 2 | 1 |
First page |
Previous page |
Next page |
Last page |