Previous module |
Next module
Module #661, TG: 2.8, TC: 2, 116 probes, 115 Entrez genes, 3 conditions

HELP
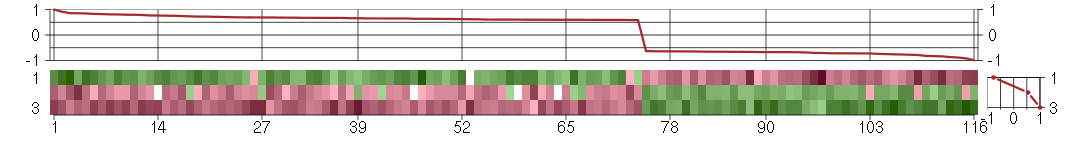
The image plot shows the color-coded level of gene expression, for the
genes and conditions in a given transcription module. The genes are on
the horizontal, the conditions on the vertical axis.
The genes are ordered according to their ISA gene scores, similarly
the conditions are ordered according to their condition scores. The
score of a gene means the «degree of inclusion» in
the module: a high score gene is essential in the module.
Condition scores can also be negative, that means that the genes of
the module are all down-regulated in the condition. Here the absolute
value of the score gives the «degree of inclusion».
The plots above and beside the expression matrix show the gene scores
and condition scores, respectively.
Note that the plot is interactive, you can see the name of the gene
and condition under the mouse cursor.
The expression matrix was normalized to have mean zero and standard
deviation one for every gene separately across all conditions
(i.e. not just for the conditions in the module).
— Click on the Help button again to close this help window.

Under-expression is coded with green,
over-expression with red color.
Help |
Hide |
Top
Help |
Show |
Top
The GO tree — Biological processes
HELP
This is one of three sections showing Gene Ontology enrichment of the
current module: in this case for biological processes.
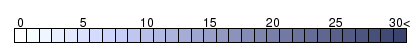
The graph shows the hierarchy of the GO categories, their enrichment
for the current module is color coded, and the blue number beside the
category is the minus log ten p-value of the enrichment. (Calculated
using the standard hypergeometric test.) The color of the arrows code
«is a» (cyan) and «part of» relationships.
The tree was built the following way. First all GO terms with more
significant enrichment p-value than 0.05 were collected. Then all
paths from these terms to the root node of the GO tree were included
too. If a GO term is included more than once in the tree, then the
green numbers show 1) the id of the node, this makes it easier to find
other appereances of the term, and 2) the number of appearences.
Note that the same GO category might show up on the graph many
times. This is because the GO was «straightened» for this
graph, i.e. if there are more paths from a GO term to the root node of
the tree, all of them are included. The green numbers
Move the mouse cursor over the terms to get their definition. Clicking
on them takes you to the corresponding Gene Ontology web page.
If you cannot see a graph here at all, that means that there were no
significantly enriched GO categories, at the 0.05 level.
— Click on the Help button again to close this help window.
Help |
Hide |
Top
Help |
Show |
Top
The GO tree — Cellular Components
HELP
This is one of three sections showing Gene Ontology enrichment of the
current module: in this case for cellular components.
The graph shows the hierarchy of the GO categories, their enrichment
for the current module is color coded, and the blue number beside the
category is the minus log ten p-value of the enrichment. (Calculated
using the standard hypergeometric test.) The color of the arrows code
«is a» (cyan) and «part of» relationships.
The tree was built the following way. First all GO terms with more
significant enrichment p-value than 0.05 were collected. Then all
paths from these terms to the root node of the GO tree were included
too. If a GO term is included more than once in the tree, then the
green numbers show 1) the id of the node, this makes it easier to find
other appereances of the term, and 2) the number of appearences.
Note that the same GO category might show up on the graph many
times. This is because the GO was «straightened» for this
graph, i.e. if there are more paths from a GO term to the root node of
the tree, all of them are included. The green numbers
Move the mouse cursor over the terms to get their definition. Clicking
on them takes you to the corresponding Gene Ontology web page.
If you cannot see a graph here at all, that means that there were no
significantly enriched GO categories, at the 0.05 level.
— Click on the Help button again to close this help window.
Help |
Hide |
Top
Help |
Show |
Top
The GO tree — Molecular Function
HELP
This is one of three sections showing Gene Ontology enrichment of the
current module: in this case for molecular function.
The graph shows the hierarchy of the GO categories, their enrichment
for the current module is color coded, and the blue number beside the
category is the minus log ten p-value of the enrichment. (Calculated
using the standard hypergeometric test.) The color of the arrows code
«is a» (cyan) and «part of» relationships.
The tree was built the following way. First all GO terms with more
significant enrichment p-value than 0.05 were collected. Then all
paths from these terms to the root node of the GO tree were included
too. If a GO term is included more than once in the tree, then the
green numbers show 1) the id of the node, this makes it easier to find
other appereances of the term, and 2) the number of appearences.
Note that the same GO category might show up on the graph many
times. This is because the GO was «straightened» for this
graph, i.e. if there are more paths from a GO term to the root node of
the tree, all of them are included. The green numbers
Move the mouse cursor over the terms to get their definition. Clicking
on them takes you to the corresponding Gene Ontology web page.
If you cannot see a graph here at all, that means that there were no
significantly enriched GO categories, at the 0.05 level.
— Click on the Help button again to close this help window.
Help |
Hide |
Top
Help |
Show |
Top
GO BP test for over-representation
HELP
List of all enriched GO categories (biological processes), at the 0.05
p-value level.
The columns:
- ExpCount is the expected count of genes in the
module annotated with the given GO term, just by chance.
- Count
is the number of genes in the module annotated with the given GO
term.
- Size is the total number of genes (in our universe)
annotated with the GO term.
Clicking on Count shows the genes that drive the
enrichment. You can also click on the individual numbers in
the Count column, to show the driving genes for that individual
GO category.
Clicking on the GO identifiers takes you to the Gene Ontology web
pages.
— Click on the Help button again to close this help window.
| Id | Pvalue | ExpCount | Count | Size | Term |
| GO:0030879 | 4.264e-02 | 0.1868 | 3
BCL2L11, BRCA2, NOTCH4 | 16 | mammary gland development |
Help |
Hide |
Top
Help |
Show |
Top
GO CC test for over-representation
HELP
List of all enriched GO categories (cellular components), at the 0.05
p-value level.
The columns:
- ExpCount is the expected count of genes in the
module annotated with the given GO term, just by chance.
- Count
is the number of genes in the module annotated with the given GO
term.
- Size is the total number of genes (in our universe)
annotated with the GO term.
Clicking on Count shows the genes that drive the
enrichment. You can also click on the individual numbers in
the Count column, to show the driving genes for that individual
GO category.
Clicking on the GO identifiers takes you to the Gene Ontology web
pages.
— Click on the Help button again to close this help window.
| Id | Pvalue | ExpCount | Count | Size | Term |
| GO:0005576 | 4.997e-02 | 8.01 | 17
APP, C4A, CFHR2, CLCA2, DSPP, F11, FGL1, IFNG, INHA, LILRA5, MATN3, MUC13, NOTCH4, RLN1, SAA4, SIGLEC1, VGF | 673 | extracellular region |
Help |
Hide |
Top
Help |
Show |
Top
GO MF test for over-representation
HELP
List of all enriched GO categories (molecular function), at the 0.05
p-value level.
The columns:
- ExpCount is the expected count of genes in the
module annotated with the given GO term, just by chance.
- Count
is the number of genes in the module annotated with the given GO
term.
- Size is the total number of genes (in our universe)
annotated with the GO term.
Clicking on Count shows the genes that drive the
enrichment. You can also click on the individual numbers in
the Count column, to show the driving genes for that individual
GO category.
Clicking on the GO identifiers takes you to the Gene Ontology web
pages.
— Click on the Help button again to close this help window.
Help |
Hide |
Top
Help |
Show |
Top
KEGG Pathway test for over-representation
HELP
List of all enriched KEGG pathways, at the 0.05
p-value level.
The columns:
- ExpCount is the expected count of genes in the
module annotated with the given KEGG pathway, just by chance.
- Count
is the number of genes in the module annotated with the given KEGG
pathway.
- Size is the total number of genes (in our universe)
annotated with the KEGG pathway.
Clicking on Count shows the genes that drive the
enrichment. You can also click on the individual numbers in
the Count column, to show the driving genes for that individual
KEGG pathway.
Clicking on the KEGG identifiers takes you to the KEGG web site.
— Click on the Help button again to close this help window.
Help |
Hide |
Top
Help |
Show |
Top
miRNA test for over-representation
HELP
List of all enriched miRNA families, at the 0.05
p-value level.
The columns:
- ExpCount is the expected count of genes in the
module regulated by the given miRNA family, just by chance.
- Count
is the number of genes in the module regulated by the given miRNA
family.
- Size is the total number of genes (in our universe)
regulated with the given miRNA family.
Clicking on Count shows the genes that drive the
enrichment. You can also click on the individual numbers in
the Count column, to show the driving genes for that individual
miRNA family.
The miRNA regulation data was taken from the TargetScan database.
(Only the conserved sites were used for the current analysis.)
Clicking on the miRNA names takes you to the TargetScan web site.
— Click on the Help button again to close this help window.
Help |
Hide |
Top
Help |
Show |
Top
Chromosome test for over-representation
HELP
List of all enriched Chromosomes, at the 0.05
p-value level.
The columns:
- ExpCount is the expected number of genes in the
module on the given chromosome, just by chance.
- Count
is the number of genes in the module on the given chromosome.
- Size is the total number of genes (in our universe)
on the given chromosome.
Clicking on Count shows the genes that drive the
enrichment. You can also click on the individual numbers in
the Count column, to show the driving genes for that individual
chromosome.
— Click on the Help button again to close this help window.
HELP
A list of all genes in the current module, in alphabetical order. The
size of the text corresponds to the gene scores.
Note that some gene symbols may show up more than once, if many
probes match the same Entrez gene.
Genes with no Entrez mapping are given separately, with their
Affymetrics probe ID.
— Click on the Help button again to close this help window.
Entrez genes
ABHD2abhydrolase domain containing 2 (221815_at), score: 0.59
ADORA1adenosine A1 receptor (216220_s_at), score: 0.63
AFF2AF4/FMR2 family, member 2 (206105_at), score: 0.63
APPamyloid beta (A4) precursor protein (200602_at), score: 0.59
B9D1B9 protein domain 1 (210534_s_at), score: -0.66
BCL2L11BCL2-like 11 (apoptosis facilitator) (222343_at), score: 0.6
BET1Lblocked early in transport 1 homolog (S. cerevisiae)-like (220470_at), score: -0.82
BRCA2breast cancer 2, early onset (208368_s_at), score: 0.85
C19orf40chromosome 19 open reading frame 40 (214816_x_at), score: 0.75
C21orf91chromosome 21 open reading frame 91 (220941_s_at), score: -0.83
C4Acomplement component 4A (Rodgers blood group) (214428_x_at), score: 0.6
C8orf60chromosome 8 open reading frame 60 (220712_at), score: 0.77
CALB1calbindin 1, 28kDa (205626_s_at), score: 0.68
CAPZA1capping protein (actin filament) muscle Z-line, alpha 1 (208374_s_at), score: 0.69
CCDC40coiled-coil domain containing 40 (220592_at), score: 0.6
CEP192centrosomal protein 192kDa (218827_s_at), score: 0.68
CFHR2complement factor H-related 2 (206910_x_at), score: 0.61
CHRM3cholinergic receptor, muscarinic 3 (214596_at), score: -0.68
CHRNA6cholinergic receptor, nicotinic, alpha 6 (207568_at), score: 0.81
CLCA2chloride channel accessory 2 (206165_s_at), score: -0.76
CLIP1CAP-GLY domain containing linker protein 1 (210716_s_at), score: 0.62
CNNM3cyclin M3 (220739_s_at), score: -0.67
CTTNcortactin (201059_at), score: 0.6
CYP3A4cytochrome P450, family 3, subfamily A, polypeptide 4 (205998_x_at), score: 0.6
CYTH4cytohesin 4 (219183_s_at), score: 0.74
DBPD site of albumin promoter (albumin D-box) binding protein (40273_at), score: -0.64
DKFZP586I1420hypothetical protein DKFZp586I1420 (213546_at), score: 0.59
DSPPdentin sialophosphoprotein (221681_s_at), score: 0.81
ENPP4ectonucleotide pyrophosphatase/phosphodiesterase 4 (putative function) (204160_s_at), score: -0.66
F11coagulation factor XI (206610_s_at), score: 0.86
FAM134Bfamily with sequence similarity 134, member B (218532_s_at), score: -0.78
FAM169Afamily with sequence similarity 169, member A (213954_at), score: -0.65
FANCCFanconi anemia, complementation group C (205189_s_at), score: 0.71
FGL1fibrinogen-like 1 (205305_at), score: 0.69
FKBP10FK506 binding protein 10, 65 kDa (219249_s_at), score: 0.76
FOXK2forkhead box K2 (203064_s_at), score: -0.65
FOXN3forkhead box N3 (218031_s_at), score: -0.87
GPHNgephyrin (220773_s_at), score: -0.72
GPRASP1G protein-coupled receptor associated sorting protein 1 (204793_at), score: -0.74
HAB1B1 for mucin (215778_x_at), score: 0.71
HECTD3HECT domain containing 3 (218632_at), score: -0.7
HLA-DMBmajor histocompatibility complex, class II, DM beta (203932_at), score: 0.69
HLA-DRB1major histocompatibility complex, class II, DR beta 1 (209312_x_at), score: 0.65
IFNGinterferon, gamma (210354_at), score: 0.72
INHAinhibin, alpha (210141_s_at), score: 0.67
KAT2BK(lysine) acetyltransferase 2B (203845_at), score: 0.65
KIAA0355KIAA0355 (203288_at), score: -0.99
KIAA1305KIAA1305 (220911_s_at), score: -0.84
KRI1KRI1 homolog (S. cerevisiae) (218798_at), score: 0.62
KRT24keratin 24 (220267_at), score: 0.67
KRT9keratin 9 (208188_at), score: 0.91
LILRA5leukocyte immunoglobulin-like receptor, subfamily A (with TM domain), member 5 (215838_at), score: 0.78
LLGL2lethal giant larvae homolog 2 (Drosophila) (203713_s_at), score: 0.65
LOC100188945cell division cycle associated 4 pseudogene (215109_at), score: 0.76
LOC128192similar to peptidyl-Pro cis trans isomerase (217346_at), score: 0.6
LOC390998similar to hCG1644589 (216589_at), score: 0.59
LOC391132similar to hCG2041276 (216177_at), score: 1
LOC80054hypothetical LOC80054 (220465_at), score: 0.63
MATN3matrilin 3 (206091_at), score: -0.65
MEF2Cmyocyte enhancer factor 2C (209199_s_at), score: -0.67
MICAL3microtubule associated monoxygenase, calponin and LIM domain containing 3 (212715_s_at), score: -0.63
MLYCDmalonyl-CoA decarboxylase (218869_at), score: -0.66
MUC13mucin 13, cell surface associated (218687_s_at), score: 0.69
NACA2nascent polypeptide-associated complex alpha subunit 2 (222224_at), score: 0.8
NCKAP1NCK-associated protein 1 (207738_s_at), score: 0.68
NDRG4NDRG family member 4 (209159_s_at), score: -0.71
NOTCH4Notch homolog 4 (Drosophila) (205247_at), score: 0.65
NUDT11nudix (nucleoside diphosphate linked moiety X)-type motif 11 (219855_at), score: -0.67
NUPL2nucleoporin like 2 (204003_s_at), score: 0.6
PHC1polyhomeotic homolog 1 (Drosophila) (218338_at), score: -0.76
PKP2plakophilin 2 (207717_s_at), score: 0.66
PLA2G6phospholipase A2, group VI (cytosolic, calcium-independent) (215938_s_at), score: 0.63
POLHpolymerase (DNA directed), eta (219380_x_at), score: 0.72
PYHIN1pyrin and HIN domain family, member 1 (216748_at), score: 0.73
RAB28RAB28, member RAS oncogene family (207495_at), score: 0.7
RAB3ARAB3A, member RAS oncogene family (204974_at), score: 0.64
RABGGTARab geranylgeranyltransferase, alpha subunit (203573_s_at), score: -0.68
RBL2retinoblastoma-like 2 (p130) (212331_at), score: 0.59
RBM12BRNA binding motif protein 12B (51228_at), score: -0.72
RBM4BRNA binding motif protein 4B (209497_s_at), score: -0.72
RFWD3ring finger and WD repeat domain 3 (218564_at), score: 0.6
RLN1relaxin 1 (211753_s_at), score: 0.6
RPL18AP6ribosomal protein L18a pseudogene 6 (216383_at), score: 0.6
RPL21P68ribosomal protein L21 pseudogene 68 (217340_at), score: 0.67
RPL27Aribosomal protein L27a (212044_s_at), score: 0.69
RPLP2P1ribosomal protein, large P2, pseudogene 1 (216490_x_at), score: 0.67
RPS11ribosomal protein S11 (213350_at), score: 0.66
RXRBretinoid X receptor, beta (215099_s_at), score: -0.67
S100A14S100 calcium binding protein A14 (218677_at), score: 0.82
SAA4serum amyloid A4, constitutive (207096_at), score: 0.84
SEC14L5SEC14-like 5 (S. cerevisiae) (210169_at), score: 0.6
SH2D3ASH2 domain containing 3A (222169_x_at), score: 0.79
SHQ1SHQ1 homolog (S. cerevisiae) (63009_at), score: -0.66
SIGLEC1sialic acid binding Ig-like lectin 1, sialoadhesin (44673_at), score: 0.65
SLC10A2solute carrier family 10 (sodium/bile acid cotransporter family), member 2 (207095_at), score: -0.67
SLC27A3solute carrier family 27 (fatty acid transporter), member 3 (222217_s_at), score: -0.64
SLC9A7solute carrier family 9 (sodium/hydrogen exchanger), member 7 (214860_at), score: -0.72
SNX27sorting nexin family member 27 (221006_s_at), score: -0.64
STIM1stromal interaction molecule 1 (202764_at), score: -0.91
STK11serine/threonine kinase 11 (41657_at), score: -0.66
TAF15TAF15 RNA polymerase II, TATA box binding protein (TBP)-associated factor, 68kDa (202840_at), score: 0.63
TIAF1TGFB1-induced anti-apoptotic factor 1 (202039_at), score: -0.72
TMSB4Ythymosin beta 4, Y-linked (206769_at), score: 0.62
TNK1tyrosine kinase, non-receptor, 1 (217149_x_at), score: 0.83
TWISTNBTWIST neighbor (214729_at), score: -0.64
UBTD1ubiquitin domain containing 1 (219172_at), score: -0.64
UNC84Aunc-84 homolog A (C. elegans) (212074_at), score: 0.61
USP20ubiquitin specific peptidase 20 (203965_at), score: -0.88
VGFVGF nerve growth factor inducible (205586_x_at), score: 0.65
ZNF107zinc finger protein 107 (205739_x_at), score: 0.67
ZNF419zinc finger protein 419 (219826_at), score: -0.77
ZNF426zinc finger protein 426 (205964_at), score: 0.59
ZNF430zinc finger protein 430 (206829_x_at), score: 0.59
ZNF702Pzinc finger protein 702 pseudogene (206557_at), score: -0.75
ZNF780Bzinc finger protein 780B (215570_s_at), score: -0.72
Non-Entrez genes
204793_atUnknown, score: 0.67
HELP
Conditions in the module, given in the same order as on the expression
plot above. Red color means over-expression, green under-expression in
the given condition.
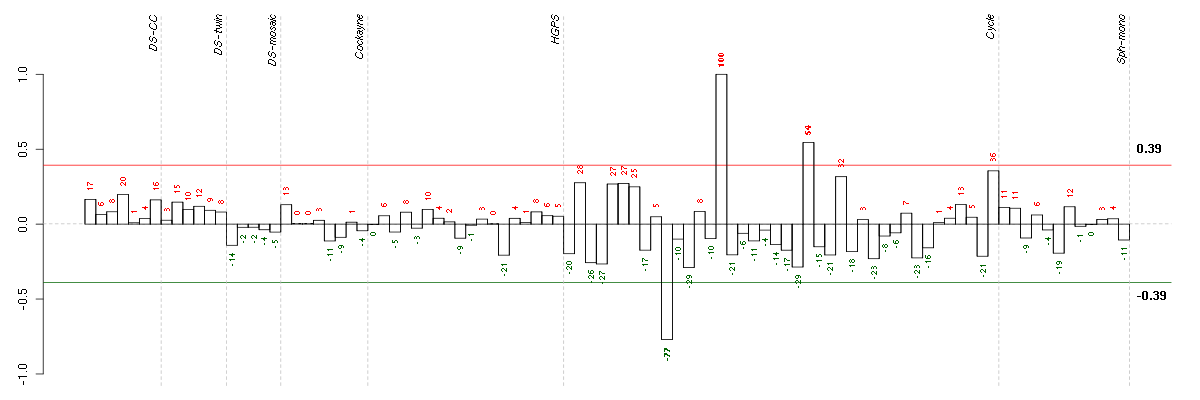
The barplot below shows the condition (sample) scores. A separate bar
is shown for each sample, its height is the corresponding score of the
sample in the module. The red and green numbers on the bars are the
sample scores expressed in percents, i.e. 100% is 1.0.
The red and green lines show the module thresholds, samples above
the red line and below the green line are included in the module.
The different experiments that were part of the study, are separated
by dashed vertical lines.
— Click on the Help button again to close this help window.
| Id | sample | Experiment | ExpName | Array | Syndrome | Cell.line |
| E-TABM-263-raw-cel-1515485831.cel | 10 | 6 | Cycle | hgu133a2 | none | Cycle 1 |
| E-TABM-263-raw-cel-1515486091.cel | 23 | 6 | Cycle | hgu133a2 | none | Cycle 1 |
| E-TABM-263-raw-cel-1515485931.cel | 15 | 6 | Cycle | hgu133a2 | none | Cycle 1 |


© 2008-2010 Computational Biology Group, Department of Medical Genetics,
University of Lausanne, Switzerland