Previous module |
Next module
Module #777, TG: 2.6, TC: 1.8, 66 probes, 66 Entrez genes, 5 conditions


HELP
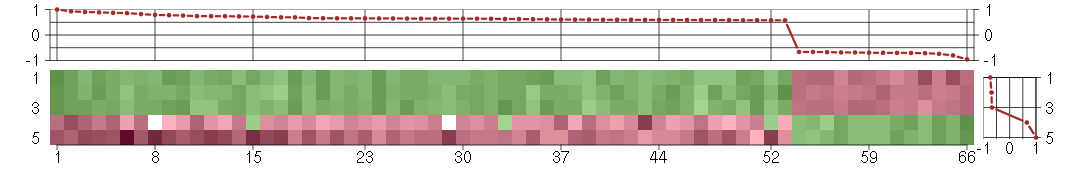
The image plot shows the color-coded level of gene expression, for the
genes and conditions in a given transcription module. The genes are on
the horizontal, the conditions on the vertical axis.
The genes are ordered according to their ISA gene scores, similarly
the conditions are ordered according to their condition scores. The
score of a gene means the «degree of inclusion» in
the module: a high score gene is essential in the module.
Condition scores can also be negative, that means that the genes of
the module are all down-regulated in the condition. Here the absolute
value of the score gives the «degree of inclusion».
The plots above and beside the expression matrix show the gene scores
and condition scores, respectively.
Note that the plot is interactive, you can see the name of the gene
and condition under the mouse cursor.
The expression matrix was normalized to have mean zero and standard
deviation one for every gene separately across all conditions
(i.e. not just for the conditions in the module).
— Click on the Help button again to close this help window.

Under-expression is coded with green,
over-expression with red color.
Help |
Hide |
Top
Help |
Show |
Top
The GO tree — Biological processes
HELP
This is one of three sections showing Gene Ontology enrichment of the
current module: in this case for biological processes.
The graph shows the hierarchy of the GO categories, their enrichment
for the current module is color coded, and the blue number beside the
category is the minus log ten p-value of the enrichment. (Calculated
using the standard hypergeometric test.) The color of the arrows code
«is a» (cyan) and «part of» relationships.
The tree was built the following way. First all GO terms with more
significant enrichment p-value than 0.05 were collected. Then all
paths from these terms to the root node of the GO tree were included
too. If a GO term is included more than once in the tree, then the
green numbers show 1) the id of the node, this makes it easier to find
other appereances of the term, and 2) the number of appearences.
Note that the same GO category might show up on the graph many
times. This is because the GO was «straightened» for this
graph, i.e. if there are more paths from a GO term to the root node of
the tree, all of them are included. The green numbers
Move the mouse cursor over the terms to get their definition. Clicking
on them takes you to the corresponding Gene Ontology web page.
If you cannot see a graph here at all, that means that there were no
significantly enriched GO categories, at the 0.05 level.
— Click on the Help button again to close this help window.
immune system process
Any process involved in the development or functioning of the immune system, an organismal system for calibrated responses to potential internal or invasive threats.
antigen processing and presentation of peptide or polysaccharide antigen via MHC class II
The process by which an antigen-presenting cell expresses antigen (peptide or polysaccharide) on its cell surface in association with an MHC class II protein complex.
immune response
Any immune system process that functions in the calibrated response of an organism to a potential internal or invasive threat.
digestion
The whole of the physical, chemical, and biochemical processes carried out by multicellular organisms to break down ingested nutrients into components that may be easily absorbed and directed into metabolism.
biological_process
Any process specifically pertinent to the functioning of integrated living units: cells, tissues, organs, and organisms. A process is a collection of molecular events with a defined beginning and end.
antigen processing and presentation
The process by which an antigen-presenting cell expresses antigen (peptide or lipid) on its cell surface in association with an MHC protein complex.
multicellular organismal process
Any biological process, occurring at the level of a multicellular organism, pertinent to its function.
response to stimulus
A change in state or activity of a cell or an organism (in terms of movement, secretion, enzyme production, gene expression, etc.) as a result of a stimulus.
all
This term is the most general term possible
immune response
Any immune system process that functions in the calibrated response of an organism to a potential internal or invasive threat.
Help |
Hide |
Top
Help |
Show |
Top
The GO tree — Cellular Components
HELP
This is one of three sections showing Gene Ontology enrichment of the
current module: in this case for cellular components.
The graph shows the hierarchy of the GO categories, their enrichment
for the current module is color coded, and the blue number beside the
category is the minus log ten p-value of the enrichment. (Calculated
using the standard hypergeometric test.) The color of the arrows code
«is a» (cyan) and «part of» relationships.
The tree was built the following way. First all GO terms with more
significant enrichment p-value than 0.05 were collected. Then all
paths from these terms to the root node of the GO tree were included
too. If a GO term is included more than once in the tree, then the
green numbers show 1) the id of the node, this makes it easier to find
other appereances of the term, and 2) the number of appearences.
Note that the same GO category might show up on the graph many
times. This is because the GO was «straightened» for this
graph, i.e. if there are more paths from a GO term to the root node of
the tree, all of them are included. The green numbers
Move the mouse cursor over the terms to get their definition. Clicking
on them takes you to the corresponding Gene Ontology web page.
If you cannot see a graph here at all, that means that there were no
significantly enriched GO categories, at the 0.05 level.
— Click on the Help button again to close this help window.
plasma membrane
The membrane surrounding a cell that separates the cell from its external environment. It consists of a phospholipid bilayer and associated proteins.
membrane
Double layer of lipid molecules that encloses all cells, and, in eukaryotes, many organelles; may be a single or double lipid bilayer; also includes associated proteins.
MHC class II protein complex
A transmembrane protein complex composed of an MHC class II alpha and MHC class II beta chain, and with or without a bound peptide or polysaccharide antigen.
cellular_component
The part of a cell or its extracellular environment in which a gene product is located. A gene product may be located in one or more parts of a cell and its location may be as specific as a particular macromolecular complex, that is, a stable, persistent association of macromolecules that function together.
cell
The basic structural and functional unit of all organisms. Includes the plasma membrane and any external encapsulating structures such as the cell wall and cell envelope.
macromolecular complex
A stable assembly of two or more macromolecules, i.e. proteins, nucleic acids, carbohydrates or lipids, in which the constituent parts function together.
MHC protein complex
A transmembrane protein complex composed of an MHC alpha chain and, in most cases, either an MHC class II beta chain or an invariant beta2-microglobin chain, and with or without a bound peptide, lipid, or polysaccharide antigen.
protein complex
Any macromolecular complex composed of two or more polypeptide subunits, which may or may not be identical. Protein complexes may have other associated non-protein prosthetic groups, such as nucleotides, metal ions or carbohydrate groups.
membrane part
Any constituent part of a membrane, a double layer of lipid molecules that encloses all cells, and, in eukaryotes, many organelles; may be a single or double lipid bilayer; also includes associated proteins.
plasma membrane part
Any constituent part of the plasma membrane, the membrane surrounding a cell that separates the cell from its external environment. It consists of a phospholipid bilayer and associated proteins.
cell part
Any constituent part of a cell, the basic structural and functional unit of all organisms.
all
This term is the most general term possible
cell part
Any constituent part of a cell, the basic structural and functional unit of all organisms.
membrane part
Any constituent part of a membrane, a double layer of lipid molecules that encloses all cells, and, in eukaryotes, many organelles; may be a single or double lipid bilayer; also includes associated proteins.
plasma membrane part
Any constituent part of the plasma membrane, the membrane surrounding a cell that separates the cell from its external environment. It consists of a phospholipid bilayer and associated proteins.
MHC protein complex
A transmembrane protein complex composed of an MHC alpha chain and, in most cases, either an MHC class II beta chain or an invariant beta2-microglobin chain, and with or without a bound peptide, lipid, or polysaccharide antigen.
Help |
Hide |
Top
Help |
Show |
Top
The GO tree — Molecular Function
HELP
This is one of three sections showing Gene Ontology enrichment of the
current module: in this case for molecular function.
The graph shows the hierarchy of the GO categories, their enrichment
for the current module is color coded, and the blue number beside the
category is the minus log ten p-value of the enrichment. (Calculated
using the standard hypergeometric test.) The color of the arrows code
«is a» (cyan) and «part of» relationships.
The tree was built the following way. First all GO terms with more
significant enrichment p-value than 0.05 were collected. Then all
paths from these terms to the root node of the GO tree were included
too. If a GO term is included more than once in the tree, then the
green numbers show 1) the id of the node, this makes it easier to find
other appereances of the term, and 2) the number of appearences.
Note that the same GO category might show up on the graph many
times. This is because the GO was «straightened» for this
graph, i.e. if there are more paths from a GO term to the root node of
the tree, all of them are included. The green numbers
Move the mouse cursor over the terms to get their definition. Clicking
on them takes you to the corresponding Gene Ontology web page.
If you cannot see a graph here at all, that means that there were no
significantly enriched GO categories, at the 0.05 level.
— Click on the Help button again to close this help window.
molecular_function
Elemental activities, such as catalysis or binding, describing the actions of a gene product at the molecular level. A given gene product may exhibit one or more molecular functions.
catalytic activity
Catalysis of a biochemical reaction at physiological temperatures. In biologically catalyzed reactions, the reactants are known as substrates, and the catalysts are naturally occurring macromolecular substances known as enzymes. Enzymes possess specific binding sites for substrates, and are usually composed wholly or largely of protein, but RNA that has catalytic activity (ribozyme) is often also regarded as enzymatic.
aldo-keto reductase activity
Catalysis of the NADPH-dependent reduction of carbonyl compounds.
oxidoreductase activity
Catalysis of an oxidation-reduction (redox) reaction, a reversible chemical reaction in which the oxidation state of an atom or atoms within a molecule is altered. One substrate acts as a hydrogen or electron donor and becomes oxidized, while the other acts as hydrogen or electron acceptor and becomes reduced.
steroid dehydrogenase activity
Catalysis of an oxidation-reduction (redox) reaction in which one substrate is a sterol derivative.
oxidoreductase activity, acting on CH-OH group of donors
Catalysis of an oxidation-reduction (redox) reaction in which a CH-OH group act as a hydrogen or electron donor and reduces a hydrogen or electron acceptor.
oxidoreductase activity, acting on the CH-OH group of donors, NAD or NADP as acceptor
Catalysis of an oxidation-reduction (redox) reaction in which a CH-OH group acts as a hydrogen or electron donor and reduces NAD+ or NADP.
oxidoreductase activity, acting on the CH-CH group of donors
Catalysis of an oxidation-reduction (redox) reaction in which a CH-CH group acts as a hydrogen or electron donor and reduces a hydrogen or electron acceptor.
oxidoreductase activity, acting on the CH-CH group of donors, NAD or NADP as acceptor
Catalysis of an oxidation-reduction (redox) reaction in which a CH-CH group acts as a hydrogen or electron donor and reduces NAD or NADP.
steroid dehydrogenase activity, acting on the CH-OH group of donors, NAD or NADP as acceptor
Catalysis of an oxidation-reduction (redox) reaction in which a CH-OH group acts as a hydrogen or electron donor and reduces NAD+ or NADP, and in which one substrate is a sterol derivative.
3-alpha-hydroxysteroid dehydrogenase (A-specific) activity
Catalysis of the reaction: NAD(P)+ + androsterone = NAD(P)H + H+ + 5-alpha-androstane-3,17-dione. The reaction is A-specific (i.e. the pro-R hydrogen is transferred from the 4-position of reduced nicotinamide cofactor) with respect to NAD(P)+.
trans-1,2-dihydrobenzene-1,2-diol dehydrogenase activity
Catalysis of the reaction: NADP+ + trans-1,2-dihydrobenzene-1,2-diol = NADPH + catechol.
all
This term is the most general term possible
steroid dehydrogenase activity, acting on the CH-OH group of donors, NAD or NADP as acceptor
Catalysis of an oxidation-reduction (redox) reaction in which a CH-OH group acts as a hydrogen or electron donor and reduces NAD+ or NADP, and in which one substrate is a sterol derivative.
Help |
Hide |
Top
Help |
Show |
Top
GO BP test for over-representation
HELP
List of all enriched GO categories (biological processes), at the 0.05
p-value level.
The columns:
- ExpCount is the expected count of genes in the
module annotated with the given GO term, just by chance.
- Count
is the number of genes in the module annotated with the given GO
term.
- Size is the total number of genes (in our universe)
annotated with the GO term.
Clicking on Count shows the genes that drive the
enrichment. You can also click on the individual numbers in
the Count column, to show the driving genes for that individual
GO category.
Clicking on the GO identifiers takes you to the Gene Ontology web
pages.
— Click on the Help button again to close this help window.
| Id | Pvalue | ExpCount | Count | Size | Term |
| GO:0032501 | 5.498e-04 | 12.31 | 28
AKR1B10, AKR1C1, AKR1C2, BMP7, CELSR1, CELSR3, CREG1, DGKD, DLX4, FAM65B, FGF13, GABRA2, GCLC, GREM1, HEY1, HLA-DMA, IL1RAPL1, IL23A, LEF1, LUM, MPPED2, NPTX1, PPARGC1A, RARB, SNAP25, TBXA2R, TGFB2, VCAM1 | 1611 | multicellular organismal process |
| GO:0006955 | 1.271e-03 | 2.194 | 11
B2M, CFI, CTSS, HLA-DMA, HLA-DRB1, HLA-DRB4, IL1RAPL1, IL23A, KYNU, SQSTM1, TGFB2 | 287 | immune response |
| GO:0002376 | 4.239e-03 | 3.562 | 13
B2M, CFI, CTSS, HLA-DMA, HLA-DRB1, HLA-DRB4, IL1RAPL1, IL23A, KYNU, NDRG1, SQSTM1, TGFB2, VCAM1 | 466 | immune system process |
| GO:0007586 | 4.757e-03 | 0.1987 | 4
AKR1B10, AKR1C1, AKR1C2, PPARGC1A | 26 | digestion |
| GO:0002504 | 7.115e-03 | 0.08407 | 3
HLA-DMA, HLA-DRB1, HLA-DRB4 | 11 | antigen processing and presentation of peptide or polysaccharide antigen via MHC class II |
| GO:0007435 | 1.466e-02 | 0.02293 | 2
BMP7, TGFB2 | 3 | salivary gland morphogenesis |
| GO:0009410 | 1.768e-02 | 0.1223 | 3
AKR1C1, GCLC, KYNU | 16 | response to xenobiotic stimulus |
| GO:0019882 | 1.811e-02 | 0.3057 | 4
B2M, HLA-DMA, HLA-DRB1, HLA-DRB4 | 40 | antigen processing and presentation |
| GO:0007431 | 2.436e-02 | 0.03057 | 2
BMP7, TGFB2 | 4 | salivary gland development |
| GO:0022612 | 2.436e-02 | 0.03057 | 2
BMP7, TGFB2 | 4 | gland morphogenesis |
| GO:0035272 | 4.526e-02 | 0.04586 | 2
BMP7, TGFB2 | 6 | exocrine system development |
| GO:0032787 | 4.603e-02 | 1.131 | 6
ACSL5, AKR1C1, AKR1C2, AKR1C3, KYNU, PPARGC1A | 148 | monocarboxylic acid metabolic process |
Help |
Hide |
Top
Help |
Show |
Top
GO CC test for over-representation
HELP
List of all enriched GO categories (cellular components), at the 0.05
p-value level.
The columns:
- ExpCount is the expected count of genes in the
module annotated with the given GO term, just by chance.
- Count
is the number of genes in the module annotated with the given GO
term.
- Size is the total number of genes (in our universe)
annotated with the GO term.
Clicking on Count shows the genes that drive the
enrichment. You can also click on the individual numbers in
the Count column, to show the driving genes for that individual
GO category.
Clicking on the GO identifiers takes you to the Gene Ontology web
pages.
— Click on the Help button again to close this help window.
| Id | Pvalue | ExpCount | Count | Size | Term |
| GO:0042613 | 7.525e-04 | 0.05465 | 3
HLA-DMA, HLA-DRB1, HLA-DRB4 | 7 | MHC class II protein complex |
| GO:0042611 | 1.026e-03 | 0.1717 | 4
B2M, HLA-DMA, HLA-DRB1, HLA-DRB4 | 22 | MHC protein complex |
Help |
Hide |
Top
Help |
Show |
Top
GO MF test for over-representation
HELP
List of all enriched GO categories (molecular function), at the 0.05
p-value level.
The columns:
- ExpCount is the expected count of genes in the
module annotated with the given GO term, just by chance.
- Count
is the number of genes in the module annotated with the given GO
term.
- Size is the total number of genes (in our universe)
annotated with the GO term.
Clicking on Count shows the genes that drive the
enrichment. You can also click on the individual numbers in
the Count column, to show the driving genes for that individual
GO category.
Clicking on the GO identifiers takes you to the Gene Ontology web
pages.
— Click on the Help button again to close this help window.
| Id | Pvalue | ExpCount | Count | Size | Term |
| GO:0047115 | 1.621e-04 | 0.02203 | 3
AKR1C1, AKR1C2, AKR1C3 | 3 | trans-1,2-dihydrobenzene-1,2-diol dehydrogenase activity |
| GO:0004033 | 2.984e-04 | 0.08078 | 4
AKR1B10, AKR1C1, AKR1C3, ALDH3A1 | 11 | aldo-keto reductase activity |
| GO:0047026 | 7.813e-03 | 0.01469 | 2
AKR1C2, AKR1C3 | 2 | 3-alpha-hydroxysteroid dehydrogenase (A-specific) activity |
| GO:0033764 | 1.312e-02 | 0.09546 | 3
AKR1C1, AKR1C2, AKR1C3 | 13 | steroid dehydrogenase activity, acting on the CH-OH group of donors, NAD or NADP as acceptor |
| GO:0016616 | 1.490e-02 | 0.492 | 5
AKR1B10, AKR1C1, AKR1C2, AKR1C3, ALDH3A1 | 67 | oxidoreductase activity, acting on the CH-OH group of donors, NAD or NADP as acceptor |
| GO:0004062 | 1.805e-02 | 0.02203 | 2
SULT1A1, SULT1A2 | 3 | aryl sulfotransferase activity |
| GO:0032052 | 1.805e-02 | 0.02203 | 2
AKR1C1, AKR1C2 | 3 | bile acid binding |
| GO:0016614 | 1.819e-02 | 0.5214 | 5
AKR1B10, AKR1C1, AKR1C2, AKR1C3, ALDH3A1 | 71 | oxidoreductase activity, acting on CH-OH group of donors |
| GO:0016229 | 1.819e-02 | 0.1101 | 3
AKR1C1, AKR1C2, AKR1C3 | 15 | steroid dehydrogenase activity |
| GO:0016628 | 2.094e-02 | 0.1175 | 3
AKR1C1, AKR1C2, AKR1C3 | 16 | oxidoreductase activity, acting on the CH-CH group of donors, NAD or NADP as acceptor |
| GO:0005102 | 4.447e-02 | 2.937 | 10
BMP7, FGF13, GFRA1, GREM1, HLA-DMA, IL23A, PPARGC1A, SQSTM1, TGFB2, VCAM1 | 400 | receptor binding |
Help |
Hide |
Top
Help |
Show |
Top
KEGG Pathway test for over-representation
HELP
List of all enriched KEGG pathways, at the 0.05
p-value level.
The columns:
- ExpCount is the expected count of genes in the
module annotated with the given KEGG pathway, just by chance.
- Count
is the number of genes in the module annotated with the given KEGG
pathway.
- Size is the total number of genes (in our universe)
annotated with the KEGG pathway.
Clicking on Count shows the genes that drive the
enrichment. You can also click on the individual numbers in
the Count column, to show the driving genes for that individual
KEGG pathway.
Clicking on the KEGG identifiers takes you to the KEGG web site.
— Click on the Help button again to close this help window.
| Id | Pvalue | ExpCount | Count | Size | Term |
| 04612 | 1.436e-02 | 0.5525 | 5
B2M, CTSS, HLA-DMA, HLA-DRB1, HLA-DRB4 | 45 | Antigen processing and presentation |
| 05310 | 1.959e-02 | 0.135 | 3
HLA-DMA, HLA-DRB1, HLA-DRB4 | 11 | Asthma |
| 00980 | 4.858e-02 | 0.4542 | 4
AKR1C1, AKR1C2, AKR1C3, ALDH3A1 | 37 | Metabolism of xenobiotics by cytochrome P450 |
Help |
Hide |
Top
Help |
Show |
Top
miRNA test for over-representation
HELP
List of all enriched miRNA families, at the 0.05
p-value level.
The columns:
- ExpCount is the expected count of genes in the
module regulated by the given miRNA family, just by chance.
- Count
is the number of genes in the module regulated by the given miRNA
family.
- Size is the total number of genes (in our universe)
regulated with the given miRNA family.
Clicking on Count shows the genes that drive the
enrichment. You can also click on the individual numbers in
the Count column, to show the driving genes for that individual
miRNA family.
The miRNA regulation data was taken from the TargetScan database.
(Only the conserved sites were used for the current analysis.)
Clicking on the miRNA names takes you to the TargetScan web site.
— Click on the Help button again to close this help window.
Help |
Hide |
Top
Help |
Show |
Top
Chromosome test for over-representation
HELP
List of all enriched Chromosomes, at the 0.05
p-value level.
The columns:
- ExpCount is the expected number of genes in the
module on the given chromosome, just by chance.
- Count
is the number of genes in the module on the given chromosome.
- Size is the total number of genes (in our universe)
on the given chromosome.
Clicking on Count shows the genes that drive the
enrichment. You can also click on the individual numbers in
the Count column, to show the driving genes for that individual
chromosome.
— Click on the Help button again to close this help window.
HELP
A list of all genes in the current module, in alphabetical order. The
size of the text corresponds to the gene scores.
Note that some gene symbols may show up more than once, if many
probes match the same Entrez gene.
Genes with no Entrez mapping are given separately, with their
Affymetrics probe ID.
— Click on the Help button again to close this help window.
Entrez genes
ACSL5acyl-CoA synthetase long-chain family member 5 (218322_s_at), score: 0.7
AKR1B10aldo-keto reductase family 1, member B10 (aldose reductase) (206561_s_at), score: 0.87
AKR1C1aldo-keto reductase family 1, member C1 (dihydrodiol dehydrogenase 1; 20-alpha (3-alpha)-hydroxysteroid dehydrogenase) (204151_x_at), score: 0.6
AKR1C2aldo-keto reductase family 1, member C2 (dihydrodiol dehydrogenase 2; bile acid binding protein; 3-alpha hydroxysteroid dehydrogenase, type III) (209699_x_at), score: 0.64
AKR1C3aldo-keto reductase family 1, member C3 (3-alpha hydroxysteroid dehydrogenase, type II) (209160_at), score: 0.64
ALDH3A1aldehyde dehydrogenase 3 family, memberA1 (205623_at), score: 0.71
B2Mbeta-2-microglobulin (216231_s_at), score: 0.59
BMP7bone morphogenetic protein 7 (209590_at), score: 0.78
C10orf81chromosome 10 open reading frame 81 (219857_at), score: 0.58
C14orf169chromosome 14 open reading frame 169 (219526_at), score: -0.68
C20orf39chromosome 20 open reading frame 39 (219310_at), score: 0.74
CADPS2Ca++-dependent secretion activator 2 (219572_at), score: 0.59
CELSR1cadherin, EGF LAG seven-pass G-type receptor 1 (flamingo homolog, Drosophila) (41660_at), score: 0.82
CELSR3cadherin, EGF LAG seven-pass G-type receptor 3 (flamingo homolog, Drosophila) (40020_at), score: 0.69
CFIcomplement factor I (203854_at), score: 0.66
CREG1cellular repressor of E1A-stimulated genes 1 (201200_at), score: 0.64
CTSScathepsin S (202901_x_at), score: 0.66
DGKDdiacylglycerol kinase, delta 130kDa (208072_s_at), score: 0.62
DLX4distal-less homeobox 4 (208216_at), score: 0.65
EGLN3egl nine homolog 3 (C. elegans) (219232_s_at), score: 0.74
FAM174Bfamily with sequence similarity 174, member B (51158_at), score: -0.8
FAM46Cfamily with sequence similarity 46, member C (220306_at), score: -0.71
FAM65Bfamily with sequence similarity 65, member B (209829_at), score: -0.66
FCGR2AFc fragment of IgG, low affinity IIa, receptor (CD32) (203561_at), score: 0.9
FGF13fibroblast growth factor 13 (205110_s_at), score: 0.65
GABRA2gamma-aminobutyric acid (GABA) A receptor, alpha 2 (207014_at), score: 0.86
GCLCglutamate-cysteine ligase, catalytic subunit (202922_at), score: 0.64
GFRA1GDNF family receptor alpha 1 (205696_s_at), score: -0.67
GREM1gremlin 1, cysteine knot superfamily, homolog (Xenopus laevis) (218469_at), score: -0.96
HEY1hairy/enhancer-of-split related with YRPW motif 1 (44783_s_at), score: 0.65
HLA-DMAmajor histocompatibility complex, class II, DM alpha (217478_s_at), score: 0.58
HLA-DRB1major histocompatibility complex, class II, DR beta 1 (209312_x_at), score: 0.79
HLA-DRB4major histocompatibility complex, class II, DR beta 4 (208306_x_at), score: 0.64
IGSF3immunoglobulin superfamily, member 3 (202421_at), score: 0.76
IL1RAPL1interleukin 1 receptor accessory protein-like 1 (220663_at), score: 0.6
IL23Ainterleukin 23, alpha subunit p19 (211796_s_at), score: -0.68
KYNUkynureninase (L-kynurenine hydrolase) (217388_s_at), score: 1
LEF1lymphoid enhancer-binding factor 1 (221558_s_at), score: 0.89
LUMlumican (201744_s_at), score: -0.7
MPPED2metallophosphoesterase domain containing 2 (205413_at), score: 0.93
MYO1Bmyosin IB (212364_at), score: -0.74
NDRG1N-myc downstream regulated 1 (200632_s_at), score: 0.73
NFE2L2nuclear factor (erythroid-derived 2)-like 2 (201146_at), score: 0.59
NPTX1neuronal pentraxin I (204684_at), score: 0.64
PEX5peroxisomal biogenesis factor 5 (203244_at), score: 0.59
POM121L9PPOM121 membrane glycoprotein-like 9 (rat) pseudogene (222253_s_at), score: 0.58
PPARGC1Aperoxisome proliferator-activated receptor gamma, coactivator 1 alpha (219195_at), score: 0.63
RARBretinoic acid receptor, beta (205080_at), score: 0.6
RBM47RNA binding motif protein 47 (218035_s_at), score: 0.74
RIPK4receptor-interacting serine-threonine kinase 4 (221215_s_at), score: 0.63
RPS4P17ribosomal protein S4X pseudogene 17 (216342_x_at), score: 0.58
SERPINB9serpin peptidase inhibitor, clade B (ovalbumin), member 9 (209723_at), score: -0.67
SH3BGRSH3 domain binding glutamic acid-rich protein (204979_s_at), score: 0.59
SLC38A4solute carrier family 38, member 4 (220786_s_at), score: -0.7
SNAP25synaptosomal-associated protein, 25kDa (202508_s_at), score: 0.62
SPANXCSPANX family, member C (220217_x_at), score: 0.61
SQSTM1sequestosome 1 (201471_s_at), score: 0.6
SULT1A1sulfotransferase family, cytosolic, 1A, phenol-preferring, member 1 (203615_x_at), score: 0.65
SULT1A2sulfotransferase family, cytosolic, 1A, phenol-preferring, member 2 (207122_x_at), score: 0.65
TBXA2Rthromboxane A2 receptor (336_at), score: -0.7
TGFB2transforming growth factor, beta 2 (220407_s_at), score: 0.59
TMEM100transmembrane protein 100 (219230_at), score: 0.58
TSC22D1TSC22 domain family, member 1 (215111_s_at), score: 0.6
TUBB6tubulin, beta 6 (209191_at), score: -0.7
VAV3vav 3 guanine nucleotide exchange factor (218807_at), score: 0.72
VCAM1vascular cell adhesion molecule 1 (203868_s_at), score: 0.66
Non-Entrez genes
Unknown, score:
HELP
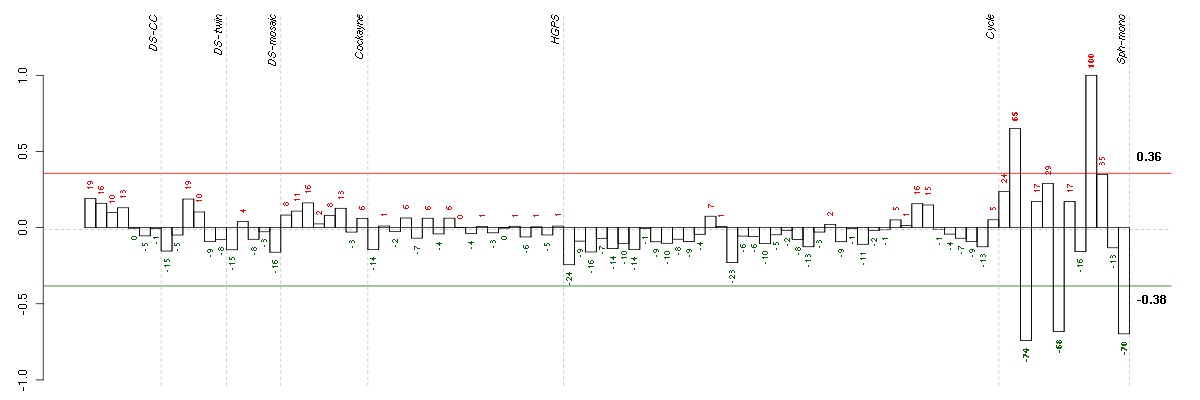
Conditions in the module, given in the same order as on the expression
plot above. Red color means over-expression, green under-expression in
the given condition.
The barplot below shows the condition (sample) scores. A separate bar
is shown for each sample, its height is the corresponding score of the
sample in the module. The red and green numbers on the bars are the
sample scores expressed in percents, i.e. 100% is 1.0.
The red and green lines show the module thresholds, samples above
the red line and below the green line are included in the module.
The different experiments that were part of the study, are separated
by dashed vertical lines.
— Click on the Help button again to close this help window.
| Id | sample | Experiment | ExpName | Array | Syndrome | Cell.line |
| E-GEOD-4219-raw-cel-1311956178.cel | 6 | 7 | Sph-mono | hgu133plus2 | none | Sph-mon 1 |
| E-GEOD-4219-raw-cel-1311956824.cel | 24 | 7 | Sph-mono | hgu133plus2 | none | Sph-mon 1 |
| E-GEOD-4219-raw-cel-1311956358.cel | 10 | 7 | Sph-mono | hgu133plus2 | none | Sph-mon 1 |
| E-GEOD-4219-raw-cel-1311956138.cel | 4 | 7 | Sph-mono | hgu133plus2 | none | Sph-mon 1 |
| E-GEOD-4219-raw-cel-1311956457.cel | 14 | 7 | Sph-mono | hgu133plus2 | none | Sph-mon 1 |


© 2008-2010 Computational Biology Group, Department of Medical Genetics,
University of Lausanne, Switzerland