Previous module |
Next module
Module #716, TG: 2.6, TC: 2, 122 probes, 122 Entrez genes, 5 conditions


HELP
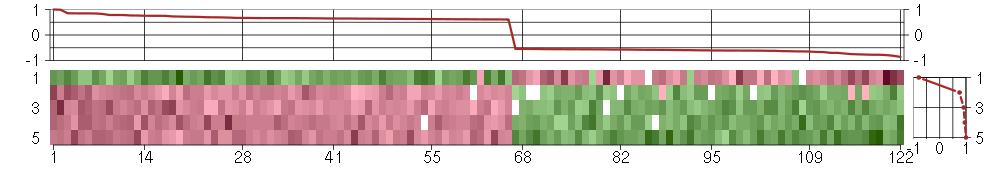
The image plot shows the color-coded level of gene expression, for the
genes and conditions in a given transcription module. The genes are on
the horizontal, the conditions on the vertical axis.
The genes are ordered according to their ISA gene scores, similarly
the conditions are ordered according to their condition scores. The
score of a gene means the «degree of inclusion» in
the module: a high score gene is essential in the module.
Condition scores can also be negative, that means that the genes of
the module are all down-regulated in the condition. Here the absolute
value of the score gives the «degree of inclusion».
The plots above and beside the expression matrix show the gene scores
and condition scores, respectively.
Note that the plot is interactive, you can see the name of the gene
and condition under the mouse cursor.
The expression matrix was normalized to have mean zero and standard
deviation one for every gene separately across all conditions
(i.e. not just for the conditions in the module).
— Click on the Help button again to close this help window.

Under-expression is coded with green,
over-expression with red color.
Help |
Hide |
Top
Help |
Show |
Top
The GO tree — Biological processes
HELP
This is one of three sections showing Gene Ontology enrichment of the
current module: in this case for biological processes.
The graph shows the hierarchy of the GO categories, their enrichment
for the current module is color coded, and the blue number beside the
category is the minus log ten p-value of the enrichment. (Calculated
using the standard hypergeometric test.) The color of the arrows code
«is a» (cyan) and «part of» relationships.
The tree was built the following way. First all GO terms with more
significant enrichment p-value than 0.05 were collected. Then all
paths from these terms to the root node of the GO tree were included
too. If a GO term is included more than once in the tree, then the
green numbers show 1) the id of the node, this makes it easier to find
other appereances of the term, and 2) the number of appearences.
Note that the same GO category might show up on the graph many
times. This is because the GO was «straightened» for this
graph, i.e. if there are more paths from a GO term to the root node of
the tree, all of them are included. The green numbers
Move the mouse cursor over the terms to get their definition. Clicking
on them takes you to the corresponding Gene Ontology web page.
If you cannot see a graph here at all, that means that there were no
significantly enriched GO categories, at the 0.05 level.
— Click on the Help button again to close this help window.

Help |
Hide |
Top
Help |
Show |
Top
The GO tree — Cellular Components
HELP
This is one of three sections showing Gene Ontology enrichment of the
current module: in this case for cellular components.
The graph shows the hierarchy of the GO categories, their enrichment
for the current module is color coded, and the blue number beside the
category is the minus log ten p-value of the enrichment. (Calculated
using the standard hypergeometric test.) The color of the arrows code
«is a» (cyan) and «part of» relationships.
The tree was built the following way. First all GO terms with more
significant enrichment p-value than 0.05 were collected. Then all
paths from these terms to the root node of the GO tree were included
too. If a GO term is included more than once in the tree, then the
green numbers show 1) the id of the node, this makes it easier to find
other appereances of the term, and 2) the number of appearences.
Note that the same GO category might show up on the graph many
times. This is because the GO was «straightened» for this
graph, i.e. if there are more paths from a GO term to the root node of
the tree, all of them are included. The green numbers
Move the mouse cursor over the terms to get their definition. Clicking
on them takes you to the corresponding Gene Ontology web page.
If you cannot see a graph here at all, that means that there were no
significantly enriched GO categories, at the 0.05 level.
— Click on the Help button again to close this help window.
Help |
Hide |
Top
Help |
Show |
Top
The GO tree — Molecular Function
HELP
This is one of three sections showing Gene Ontology enrichment of the
current module: in this case for molecular function.
The graph shows the hierarchy of the GO categories, their enrichment
for the current module is color coded, and the blue number beside the
category is the minus log ten p-value of the enrichment. (Calculated
using the standard hypergeometric test.) The color of the arrows code
«is a» (cyan) and «part of» relationships.
The tree was built the following way. First all GO terms with more
significant enrichment p-value than 0.05 were collected. Then all
paths from these terms to the root node of the GO tree were included
too. If a GO term is included more than once in the tree, then the
green numbers show 1) the id of the node, this makes it easier to find
other appereances of the term, and 2) the number of appearences.
Note that the same GO category might show up on the graph many
times. This is because the GO was «straightened» for this
graph, i.e. if there are more paths from a GO term to the root node of
the tree, all of them are included. The green numbers
Move the mouse cursor over the terms to get their definition. Clicking
on them takes you to the corresponding Gene Ontology web page.
If you cannot see a graph here at all, that means that there were no
significantly enriched GO categories, at the 0.05 level.
— Click on the Help button again to close this help window.
Help |
Hide |
Top
Help |
Show |
Top
GO BP test for over-representation
HELP
List of all enriched GO categories (biological processes), at the 0.05
p-value level.
The columns:
- ExpCount is the expected count of genes in the
module annotated with the given GO term, just by chance.
- Count
is the number of genes in the module annotated with the given GO
term.
- Size is the total number of genes (in our universe)
annotated with the GO term.
Clicking on Count shows the genes that drive the
enrichment. You can also click on the individual numbers in
the Count column, to show the driving genes for that individual
GO category.
Clicking on the GO identifiers takes you to the Gene Ontology web
pages.
— Click on the Help button again to close this help window.
| Id | Pvalue | ExpCount | Count | Size | Term |
| GO:0007182 | 3.184e-02 | 0.03947 | 2
PML, TGFBR2 | 3 | common-partner SMAD protein phosphorylation |
| GO:0014002 | 3.184e-02 | 0.03947 | 2
AGT, NF1 | 3 | astrocyte development |
| GO:0000165 | 3.884e-02 | 1.487 | 7
AGT, GADD45B, HGF, MAP3K6, NF1, PAK1, RASGRP3 | 113 | MAPKKK cascade |
Help |
Hide |
Top
Help |
Show |
Top
GO CC test for over-representation
HELP
List of all enriched GO categories (cellular components), at the 0.05
p-value level.
The columns:
- ExpCount is the expected count of genes in the
module annotated with the given GO term, just by chance.
- Count
is the number of genes in the module annotated with the given GO
term.
- Size is the total number of genes (in our universe)
annotated with the GO term.
Clicking on Count shows the genes that drive the
enrichment. You can also click on the individual numbers in
the Count column, to show the driving genes for that individual
GO category.
Clicking on the GO identifiers takes you to the Gene Ontology web
pages.
— Click on the Help button again to close this help window.
| Id | Pvalue | ExpCount | Count | Size | Term |
| GO:0044459 | 1.246e-02 | 11.7 | 24
ABCA7, ABCC9, ADORA1, BCAM, CD79B, CHRNB2, EPOR, EVI2B, FLRT3, GPR56, JAK2, JUP, KCTD15, LILRB3, LRP2, MMP17, PAK1, PXN, RASGRP3, SLC29A1, SLC6A11, SNTG1, STIM1, TGFBR2 | 875 | plasma membrane part |
| GO:0005887 | 2.367e-02 | 7.34 | 17
ABCC9, ADORA1, BCAM, CD79B, CHRNB2, EPOR, EVI2B, FLRT3, GPR56, KCTD15, LILRB3, MMP17, RASGRP3, SLC29A1, SLC6A11, STIM1, TGFBR2 | 549 | integral to plasma membrane |
| GO:0031226 | 2.571e-02 | 7.407 | 17
ABCC9, ADORA1, BCAM, CD79B, CHRNB2, EPOR, EVI2B, FLRT3, GPR56, KCTD15, LILRB3, MMP17, RASGRP3, SLC29A1, SLC6A11, STIM1, TGFBR2 | 554 | intrinsic to plasma membrane |
Help |
Hide |
Top
Help |
Show |
Top
GO MF test for over-representation
HELP
List of all enriched GO categories (molecular function), at the 0.05
p-value level.
The columns:
- ExpCount is the expected count of genes in the
module annotated with the given GO term, just by chance.
- Count
is the number of genes in the module annotated with the given GO
term.
- Size is the total number of genes (in our universe)
annotated with the GO term.
Clicking on Count shows the genes that drive the
enrichment. You can also click on the individual numbers in
the Count column, to show the driving genes for that individual
GO category.
Clicking on the GO identifiers takes you to the Gene Ontology web
pages.
— Click on the Help button again to close this help window.
Help |
Hide |
Top
Help |
Show |
Top
KEGG Pathway test for over-representation
HELP
List of all enriched KEGG pathways, at the 0.05
p-value level.
The columns:
- ExpCount is the expected count of genes in the
module annotated with the given KEGG pathway, just by chance.
- Count
is the number of genes in the module annotated with the given KEGG
pathway.
- Size is the total number of genes (in our universe)
annotated with the KEGG pathway.
Clicking on Count shows the genes that drive the
enrichment. You can also click on the individual numbers in
the Count column, to show the driving genes for that individual
KEGG pathway.
Clicking on the KEGG identifiers takes you to the KEGG web site.
— Click on the Help button again to close this help window.
Help |
Hide |
Top
Help |
Show |
Top
miRNA test for over-representation
HELP
List of all enriched miRNA families, at the 0.05
p-value level.
The columns:
- ExpCount is the expected count of genes in the
module regulated by the given miRNA family, just by chance.
- Count
is the number of genes in the module regulated by the given miRNA
family.
- Size is the total number of genes (in our universe)
regulated with the given miRNA family.
Clicking on Count shows the genes that drive the
enrichment. You can also click on the individual numbers in
the Count column, to show the driving genes for that individual
miRNA family.
The miRNA regulation data was taken from the TargetScan database.
(Only the conserved sites were used for the current analysis.)
Clicking on the miRNA names takes you to the TargetScan web site.
— Click on the Help button again to close this help window.
Help |
Hide |
Top
Help |
Show |
Top
Chromosome test for over-representation
HELP
List of all enriched Chromosomes, at the 0.05
p-value level.
The columns:
- ExpCount is the expected number of genes in the
module on the given chromosome, just by chance.
- Count
is the number of genes in the module on the given chromosome.
- Size is the total number of genes (in our universe)
on the given chromosome.
Clicking on Count shows the genes that drive the
enrichment. You can also click on the individual numbers in
the Count column, to show the driving genes for that individual
chromosome.
— Click on the Help button again to close this help window.
HELP
A list of all genes in the current module, in alphabetical order. The
size of the text corresponds to the gene scores.
Note that some gene symbols may show up more than once, if many
probes match the same Entrez gene.
Genes with no Entrez mapping are given separately, with their
Affymetrics probe ID.
— Click on the Help button again to close this help window.
Entrez genes
ABCA7ATP-binding cassette, sub-family A (ABC1), member 7 (219577_s_at), score: -0.79
ABCC9ATP-binding cassette, sub-family C (CFTR/MRP), member 9 (208561_at), score: 0.63
ADAMTS7ADAM metallopeptidase with thrombospondin type 1 motif, 7 (220705_s_at), score: -0.56
ADORA1adenosine A1 receptor (216220_s_at), score: -0.59
AGTangiotensinogen (serpin peptidase inhibitor, clade A, member 8) (202834_at), score: -0.59
ALDH1L1aldehyde dehydrogenase 1 family, member L1 (215798_at), score: -0.66
ASPHD1aspartate beta-hydroxylase domain containing 1 (214993_at), score: -0.57
BAT2HLA-B associated transcript 2 (212081_x_at), score: 0.66
BCAMbasal cell adhesion molecule (Lutheran blood group) (40093_at), score: -0.56
BCL2L1BCL2-like 1 (215037_s_at), score: 0.65
C13orf34chromosome 13 open reading frame 34 (219544_at), score: 0.66
C19orf61chromosome 19 open reading frame 61 (221335_x_at), score: 0.67
C2orf37chromosome 2 open reading frame 37 (220172_at), score: 0.75
C7orf58chromosome 7 open reading frame 58 (220032_at), score: 0.64
CCNFcyclin F (204826_at), score: 0.61
CD79BCD79b molecule, immunoglobulin-associated beta (205297_s_at), score: -0.77
CDC25Ccell division cycle 25 homolog C (S. pombe) (205167_s_at), score: 0.64
CDC42BPBCDC42 binding protein kinase beta (DMPK-like) (217849_s_at), score: 0.65
CDKN2Dcyclin-dependent kinase inhibitor 2D (p19, inhibits CDK4) (210240_s_at), score: 0.62
CHRNB2cholinergic receptor, nicotinic, beta 2 (neuronal) (206635_at), score: -0.58
CITcitron (rho-interacting, serine/threonine kinase 21) (212801_at), score: 0.62
CMAHcytidine monophosphate-N-acetylneuraminic acid hydroxylase (CMP-N-acetylneuraminate monooxygenase) pseudogene (205518_s_at), score: 0.73
CNNM1cyclin M1 (220166_at), score: -0.56
CNOT3CCR4-NOT transcription complex, subunit 3 (203239_s_at), score: 0.66
CYP3A4cytochrome P450, family 3, subfamily A, polypeptide 4 (205998_x_at), score: -0.56
DMBT1deleted in malignant brain tumors 1 (208250_s_at), score: -0.75
ELK1ELK1, member of ETS oncogene family (210376_x_at), score: 0.64
EMCNendomucin (219436_s_at), score: 0.99
EPORerythropoietin receptor (215054_at), score: 0.69
EVI2Becotropic viral integration site 2B (211742_s_at), score: 0.66
EXOC2exocyst complex component 2 (219349_s_at), score: 0.64
FAM105Afamily with sequence similarity 105, member A (219694_at), score: 0.61
FBP1fructose-1,6-bisphosphatase 1 (209696_at), score: -0.77
FBXL14F-box and leucine-rich repeat protein 14 (213145_at), score: 0.62
FKBP10FK506 binding protein 10, 65 kDa (219249_s_at), score: -0.61
FKRPfukutin related protein (219853_at), score: 0.63
FLJ21075hypothetical protein FLJ21075 (221172_at), score: -0.59
FLRT3fibronectin leucine rich transmembrane protein 3 (219250_s_at), score: 0.76
GABARAPL1GABA(A) receptor-associated protein like 1 (208868_s_at), score: -0.6
GABARAPL3GABA(A) receptors associated protein like 3 (pseudogene) (211458_s_at), score: -0.64
GADD45Bgrowth arrest and DNA-damage-inducible, beta (207574_s_at), score: -0.57
GBA3glucosidase, beta, acid 3 (cytosolic) (219954_s_at), score: -0.86
GDF9growth differentiation factor 9 (221314_at), score: -0.61
GFOD1glucose-fructose oxidoreductase domain containing 1 (219821_s_at), score: -0.62
GGA3golgi associated, gamma adaptin ear containing, ARF binding protein 3 (209411_s_at), score: 0.61
GNL3Lguanine nucleotide binding protein-like 3 (nucleolar)-like (205010_at), score: -0.56
GPR56G protein-coupled receptor 56 (212070_at), score: 0.66
H1FXH1 histone family, member X (204805_s_at), score: 0.62
HAB1B1 for mucin (215778_x_at), score: -0.67
HGFhepatocyte growth factor (hepapoietin A; scatter factor) (209960_at), score: 0.67
HIST1H1Chistone cluster 1, H1c (209398_at), score: 0.64
HIST1H4Ghistone cluster 1, H4g (208551_at), score: -0.82
HMGA1high mobility group AT-hook 1 (210457_x_at), score: 0.78
HSPA4Lheat shock 70kDa protein 4-like (205543_at), score: 0.72
INAinternexin neuronal intermediate filament protein, alpha (204465_s_at), score: 0.66
IRF2interferon regulatory factor 2 (203275_at), score: 0.61
JAK2Janus kinase 2 (a protein tyrosine kinase) (205842_s_at), score: 0.66
JUPjunction plakoglobin (201015_s_at), score: 0.75
KCTD15potassium channel tetramerisation domain containing 15 (218553_s_at), score: -0.61
KIF26Bkinesin family member 26B (220002_at), score: -0.55
LILRB3leukocyte immunoglobulin-like receptor, subfamily B (with TM and ITIM domains), member 3 (211133_x_at), score: -0.56
LPHN1latrophilin 1 (203488_at), score: -0.57
LRDDleucine-rich repeats and death domain containing (221640_s_at), score: 0.61
LRP2low density lipoprotein-related protein 2 (205710_at), score: 0.61
LRRTM4leucine rich repeat transmembrane neuronal 4 (220345_at), score: -0.61
MAP3K6mitogen-activated protein kinase kinase kinase 6 (219278_at), score: 0.67
MDM2Mdm2 p53 binding protein homolog (mouse) (205386_s_at), score: 0.63
MEOX1mesenchyme homeobox 1 (205619_s_at), score: -0.7
MMP17matrix metallopeptidase 17 (membrane-inserted) (206234_s_at), score: -0.55
MOBPmyelin-associated oligodendrocyte basic protein (210193_at), score: -0.73
MOCS1molybdenum cofactor synthesis 1 (211673_s_at), score: -0.58
MOGmyelin oligodendrocyte glycoprotein (214650_x_at), score: -0.64
MRPS6mitochondrial ribosomal protein S6 (213167_s_at), score: 0.75
MTMR11myotubularin related protein 11 (205076_s_at), score: 0.84
MYH15myosin, heavy chain 15 (215331_at), score: -0.56
NCOA2nuclear receptor coactivator 2 (205732_s_at), score: 0.71
NDPNorrie disease (pseudoglioma) (206022_at), score: 0.85
NF1neurofibromin 1 (211094_s_at), score: 0.85
NUPL2nucleoporin like 2 (204003_s_at), score: -0.55
NXPH3neurexophilin 3 (221991_at), score: -0.56
OAS32'-5'-oligoadenylate synthetase 3, 100kDa (218400_at), score: 0.65
OLFML2Bolfactomedin-like 2B (213125_at), score: 1
PAK1p21 protein (Cdc42/Rac)-activated kinase 1 (209615_s_at), score: 0.85
PDE5Aphosphodiesterase 5A, cGMP-specific (206757_at), score: 0.83
PHF7PHD finger protein 7 (215622_x_at), score: -0.58
PHTF1putative homeodomain transcription factor 1 (215285_s_at), score: 0.66
PMLpromyelocytic leukemia (206503_x_at), score: 0.65
PNMAL1PNMA-like 1 (218824_at), score: 0.69
PPP1R13Bprotein phosphatase 1, regulatory (inhibitor) subunit 13B (216347_s_at), score: -0.57
PRLHprolactin releasing hormone (221443_x_at), score: -0.55
PRMT3protein arginine methyltransferase 3 (213320_at), score: -0.59
PTPN6protein tyrosine phosphatase, non-receptor type 6 (206687_s_at), score: -0.77
PXNpaxillin (211823_s_at), score: 0.78
RASGRP3RAS guanyl releasing protein 3 (calcium and DAG-regulated) (205801_s_at), score: 0.78
REG3Aregenerating islet-derived 3 alpha (205815_at), score: -0.7
RP4-691N24.1ninein-like (207705_s_at), score: 0.75
RRP15ribosomal RNA processing 15 homolog (S. cerevisiae) (219037_at), score: -0.58
SAV1salvador homolog 1 (Drosophila) (218276_s_at), score: 0.63
SCAMP4secretory carrier membrane protein 4 (213244_at), score: 0.69
SDPRserum deprivation response (phosphatidylserine binding protein) (218711_s_at), score: 0.85
SEC61A2Sec61 alpha 2 subunit (S. cerevisiae) (219499_at), score: 0.64
SENP7SUMO1/sentrin specific peptidase 7 (220735_s_at), score: 0.68
SLC26A10solute carrier family 26, member 10 (214951_at), score: -0.65
SLC29A1solute carrier family 29 (nucleoside transporters), member 1 (201801_s_at), score: 0.72
SLC5A5solute carrier family 5 (sodium iodide symporter), member 5 (211123_at), score: -0.6
SLC6A11solute carrier family 6 (neurotransmitter transporter, GABA), member 11 (207048_at), score: -0.63
SNTG1syntrophin, gamma 1 (220405_at), score: 0.64
SPAG8sperm associated antigen 8 (206816_s_at), score: -0.57
SSX3synovial sarcoma, X breakpoint 3 (211731_x_at), score: -0.61
STIM1stromal interaction molecule 1 (202764_at), score: 0.65
SULT1B1sulfotransferase family, cytosolic, 1B, member 1 (207601_at), score: -0.64
TGFBR2transforming growth factor, beta receptor II (70/80kDa) (207334_s_at), score: 0.77
TGM4transglutaminase 4 (prostate) (217566_s_at), score: -0.76
TLE4transducin-like enhancer of split 4 (E(sp1) homolog, Drosophila) (204872_at), score: -0.56
TOM1L2target of myb1-like 2 (chicken) (214840_at), score: 0.66
TRAF5TNF receptor-associated factor 5 (204352_at), score: -0.61
TTC33tetratricopeptide repeat domain 33 (219421_at), score: 0.63
TULP2tubby like protein 2 (206733_at), score: -0.62
VEGFBvascular endothelial growth factor B (203683_s_at), score: 0.71
ZNF20zinc finger protein 20 (213916_at), score: 0.62
ZNF652zinc finger protein 652 (205594_at), score: -0.61
ZNF783zinc finger family member 783 (221876_at), score: -0.62
Non-Entrez genes
Unknown, score:
HELP
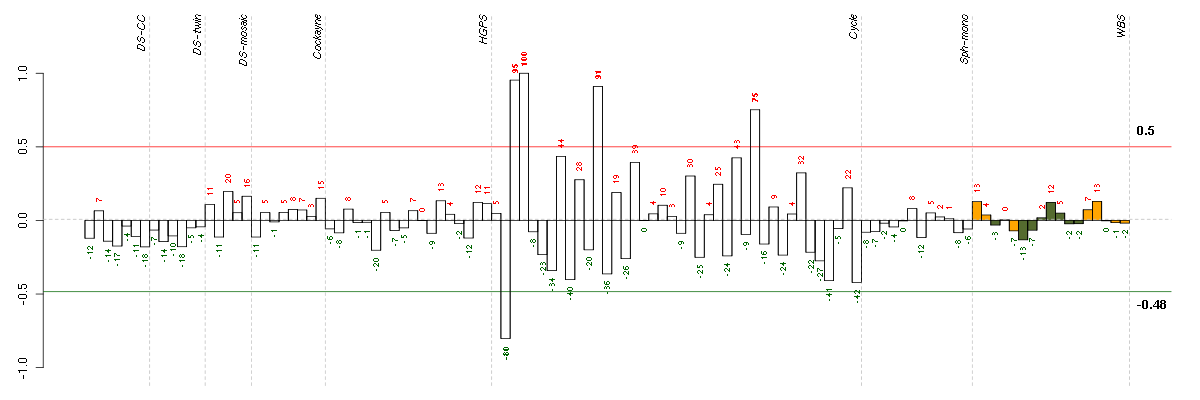
Conditions in the module, given in the same order as on the expression
plot above. Red color means over-expression, green under-expression in
the given condition.
The barplot below shows the condition (sample) scores. A separate bar
is shown for each sample, its height is the corresponding score of the
sample in the module. The red and green numbers on the bars are the
sample scores expressed in percents, i.e. 100% is 1.0.
The red and green lines show the module thresholds, samples above
the red line and below the green line are included in the module.
The different experiments that were part of the study, are separated
by dashed vertical lines.
— Click on the Help button again to close this help window.
| Id | sample | Experiment | ExpName | Array | Syndrome | Cell.line |
| E-TABM-263-raw-cel-1515485671.cel | 2 | 6 | Cycle | hgu133a2 | none | Cycle 1 |
| E-TABM-263-raw-cel-1515486211.cel | 29 | 6 | Cycle | hgu133a2 | none | Cycle 1 |
| E-TABM-263-raw-cel-1515485871.cel | 12 | 6 | Cycle | hgu133a2 | none | Cycle 1 |
| E-TABM-263-raw-cel-1515485691.cel | 3 | 6 | Cycle | hgu133a2 | none | Cycle 1 |
| E-TABM-263-raw-cel-1515485711.cel | 4 | 6 | Cycle | hgu133a2 | none | Cycle 1 |


© 2008-2010 Computational Biology Group, Department of Medical Genetics,
University of Lausanne, Switzerland