Difference between revisions of "Control of mitosis in fission yeast"
| Line 14: | Line 14: | ||
| − | + | Equations: | |
| − | [[File: | + | [[File:capture.JPG]] |
-> M(x) is the concentration and S(x) the source. The constants are: the diffusion term "D", the phosphorylation rate "k", the degradation term "α" | -> M(x) is the concentration and S(x) the source. The constants are: the diffusion term "D", the phosphorylation rate "k", the degradation term "α" | ||
Revision as of 20:05, 31 May 2012
Background: Fission yeast cells growth up to a given size and then enters mitosis. The question this project addresses is how does the cell knows it has reached to right size for division. This is achieved by a gradient of the pom1 protein along the cortex.
Biological aspects: Pom1 is a protein which forms a cortical intracellular gradient that permits to control the entry of mitosis of the fission yeast, Schizosaccharomyces pombe. The fact is that interaction of Pom1 with Cdr2 induces a cell cycle delay following to a gene activation cascade. Microtubules recruits proteins Pom1 parts of the membrane and bind to the cell poles. Then Pom1 will migrate along the membrane. They undergo five autophosphorylation cycles, which increases the probability of detachment of them. When the cells are large enough, the quantity at the equator of Pom1 attached to the membrane is not sufficient to inhibits mitosis and thus Cdr2.
Goal: The goal is to mathematically describe the mechanism by which such a gradient is achieved using differential equation and analyze such gradients from fluorescence microscopy images.
Mathematical tools: We use a diffusion equation based on partial differential equation to modelize Pom1 gradient. We use first mathematica to resolve a simple case. We use then matlab for numerical analysis of more complex cases.
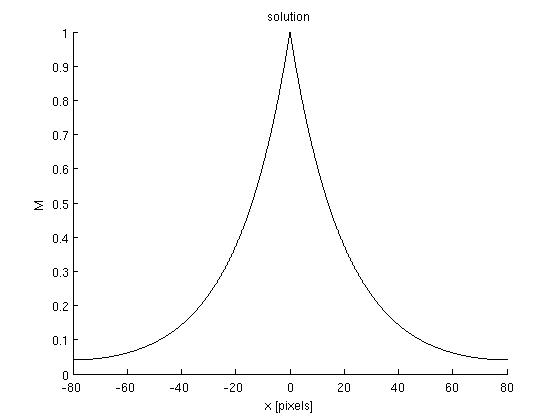
Results: Here we show the results we obtain for the following model :
- Two steps of phosphorylation (phosphorylated and non-phosphorylated)
- The same diffusion constant "D"
Equations:
-> M(x) is the concentration and S(x) the source. The constants are: the diffusion term "D", the phosphorylation rate "k", the degradation term "α"
Graph:
Discussion: The model we treated is just a approximation of the "big model" which contains six steps oh phosphorylation. But even this "big model" seems to be unadapted to describe Pom1 gradient. Indeed, the analysis of the Pom1-GFP cells with ImageJ shows that there is two different gradient per cells. At one side, the concentration of Pom1 is lower but seems to be restored in the middle of the cell. This mechanisme called "buffering" is not explained by our model. However the model we proposed seems to be consistent with Pom1 gradient formation at on side of the cell.
Supervisor: Sascha Dalessi
Students: Degrugillier Lucas, Delapierre Fabien, Merçay Johan.
Presentations: Midterm Presentation File:Présentation midterm.ppt
References: <biblio>
- hachet10 pmid=21703453
- Martin SG, Berthelot-Grosjean M. Polar gradients of the DYRK-family kinase Pom1 couple cell length with the cell cycle. Nature. 2009 Jun 11;459(7248):852-6. Epub 2009 May 27. pmid:19474792. PubMed
- Wartlick O, Kicheva A, González-Gaitán M. Morphogen gradient formation. Cold Spring Harb Perspect Biol. 2009 Sep;1(3):a001255. pmid:20066104 PubMed
</biblio>
Back to UNIL BSc course: "Solving Biological Problems that require Math 2012"

