How genetic alterations propagate to organismal level traits
Léonard Jequier, Cynthia Meizoso, Dariush Mollet
Supervisor : Sarvenaz Choobdar
Introduction Can you predict a cardiovascular disease from a certain gene expression level ? In our project, we tried to link groups of similarly expressed genes to GWAS results files in order to determine whether they were enriched for a phenotypeF. This in fact is a challenge since linking expression data to phenotypes from external data and requires the help of many different bioinformatical tools (R Studio with the packages isa2, pascal and also a gene ontology).
Methods
Our raw data was a set of protein encoding genes expression (555 genes from more than 19'000 healthy, randomized individuals) obtained from CoLaus. We also had the corresponding ensembl gene IDs.
First, the plan was to do a biclustering on the expressions data with ISA ([1] Iterative Signature Algorithm) and then test if those groups of genes (which are called modules) are linked to a phenotype using Pascal ([2] PAthway SCoring ALgorithm). The enriched modules for genes significantly linked to a phenotype were then considered as "diease modules".
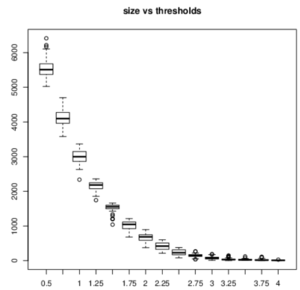
ISA is a biclustering tool. It groups the columns (= conditions) and the rows (= genes) of a matrix. To do so, it will start by creating two new matrices, by scaling the original matrix by row (Eg) and by columns (Ec). Then, a random subset of rows (mg) is selected. For each condition, the scaled gene profile of these genes is aggregated in a "condition score". The conditions for which this score is higher than the mean "condition score" by a certain number of standard deviations are selected. The number of standard deviation is a threshold that you define yourself. The higher it is, the smaller the modules will be and inversely. The same process is repeated alternatively by column and by row until mg and mc (subset of columns) remain stable. This was the procedure to find one module; it will be repeated many times with different initial subset of genes to find different modules. ISA gives a robustness score associated with each module, it corresponds to how often the module was found with different initial subset of genes.
Our next questions was: are these genes in these modules enriched for genes linked to a phenotype? To answer it, we used the PASCAL. It uses GWAS summary statistics (list of p-values for SNP-phenotype associations) to calculate a score of gene-phenotype association. Then, it gives a pathway score for sets of genes of our choice, here, the modules found by ISA. For each module, it will tell us if those genes are more often associated with the phenotype studied by the GWAS than we would expect by chance.
We used the summary statistics of 16 GWAS studying phenotype linked to cardiovascular diseases and 61 modules, selected based on their size and robustness. After correction for multiple testing, we selected the modules significantly linked to one of the 16 phenotypes and called them "disease modules".
Furthermore, a Gene Ontology enrichment (GO enrichment, [3] David Bioinformatical Database) was used to better understand the biological process happening in these disease modules. It will tell us if the disease module contains more genes involved in a certain biological process than what is expected by chance. This could give us some insight of what our module biologically represents.
Results
The biclustering gave us some trouble because of the selection of the right threshold and the right module size, which is quite arbitrary. If we had had more time, we would have run ISA several other times in order to be more sure of what is considered as a good signal.
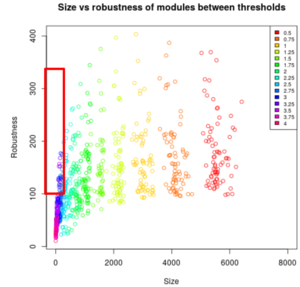
The smaller the threshold is, the bigger the size of the modules is, meaning that a lot of genes are in a module and that the biclustering was less restrictive. In our case, we needed the smaller size as possible, but not too much otherwise the robustness was too small. We got many modules and only a few of them had the right parameters (see red rectangle on the image below).
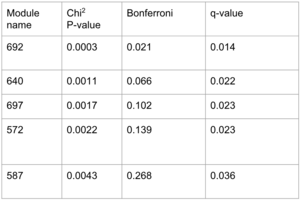
The obtained p-values from Pascal represent the significance of the association of the modules to one GWAS. Taking a look at the q-value rather than the adjusted p-values from Bonferroni correction, we found five signicant disease modules.

We compared our p-values to what we would have obtained if random (qqplot). It looks like more than five modules give a good signal for the GWAS on coronary-artery diseases, as well as for all the GWASes but less great.

We decided to do the GO enrichment on the five disease modules, but almost none gave a conclusive result. Only one disease module (module 640) indeed gave a significant p-value for its association to the GTP binding, which is quite a vast molecular function.
Conclusion
In overall, it is not only difficult to get biological information, which is relevant as well, from available repositories. It demands a good amount of time, and errors are easily made if you are not aware enough of the programs and software you use.
One should probably check the tools before using them. What tests are done ? What are the null hypothesis ? We lost a a considerable amount of time trying to answer these questions. Also, we didn’t really discuss design experiment or statistical power. We probably should have asked ourselves "which steps are useful and why ?" before going straight into the project. What does each step prove ? What steps are crucial, or not ? Is there any alternative way of answering those questions or other tools we could use ?
Also, we actually did not give the GWASs a critical look before using them which allows us to only make poor interpretation. Better selecting the studies we use would indeed help interpret the results. Finally, the software R is maybe not suited for this kind of project. Although, packages are well done, R is not a very strict language and not built towards such complex projects design. Working with object oriented tools or stricter languages might be a wiser decision, as it would resolve a lot of problems related to links between pathways, genes and molecular expression, and would be more readable (for further use).
Cheerful thanks to our supervisor for patiently taking time answer our questions and show us the right way many, many times throughout the project ! :-)
Link to the code : https://github.com/Afanc/Expression

