Difference between revisions of "User:Sbprm2015 3"
Sbprm2015 3 (talk | contribs) |
Sbprm2015 3 (talk | contribs) |
||
| Line 45: | Line 45: | ||
Project by Daniel Marbach, with Hervé Besançon, Boris Schnider, Charles Binder. | Project by Daniel Marbach, with Hervé Besançon, Boris Schnider, Charles Binder. | ||
| + | Daniel Marbach and al. papers | ||
Revision as of 09:20, 29 May 2015
Contents
Analysis of cell type and tissue-specific regulatory networks
What's the goal of the project?
In this project we tried to have a better understanding of gene networks (responsible for regulating the expression of genes in cells) and tried to realise and highlight why they are important. We also analyzed network motifs, meaning that we will take a look at their architecture (find connectivity pattern), how they are constructed and cross-regulated (number of TF per gene). Once we understood the architecture of networks we compared them together, trying to spot and analyze differences between cells or tissues.
Data presentation
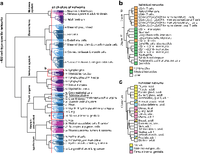
In the past information was traditionally collected from individual experiments targeting one cell type and one TF at a time. In this project we worked using a data set called FANTOM5, that regroup 400 networks of transcription regulation in over 1'000 mammalian cells. This data had been regrouped in 32 clusters separating cell types and tissues. (figure 1)
Boxplot
We made a boxplot of the number of transcription factors (TFs) per gene(figure 2), where in X we had our networks and in Y the number of TFs per gene. This gave us an indication of the networks’ complexity. In fact the more TFs a gene has to be regulated, the more complex its regulation should be. According to this, we cannot say there is a different number of TFs per network but that there are more connections between genes in some networks. Cells were matched by group according to their median on our boxplot. We can also notice a huge variance for each network. Obviously the variance of regulation complexity between two genes can be huge. We also need to add that we took in account the outliers to build this graph, but we masked them afterwards to make the boxplot more readable. We can see on figure 3 that a few immune cells (leukocytes and t cells) and nervous cells tend to have more TFs per gene and therefore a more complex regulation of their gene. This difference of complexity seems to make sense as it involves immune cells and nervous cells. Immune cells need to be very various to cover the large variety of pathogenes and to be so specific. Nervous cells need to be very controlled to have right transmission between cells and use a complex regulatory pathway.
Heatmap with network motifs analysis
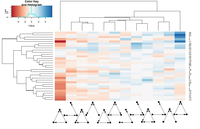
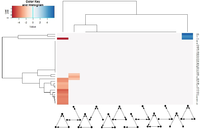
We performed a network motifs analysis, analyzing 3 knots motifs. For this we used a tool for fast motif analysis called Fanmod which allowed us to compare our 32 networks to 4000 random networks. With the settings we used, the 32 networks were compared to a sampling of 10% of all 3 knots’ motifs in random networks. It is also to mention that Fanmod generate random network where each knot keep the same number of link but are switched with one another. The results were plotted on two heatmaps showing Z-scores. The first one (figure 4) showed the total set of data. In blue are motifs that were more present in true networks than in random networks and the color red represent motifs that were less present in true networks than in random networks. In this first heatmap, 2 tendencies were showed: first the feed forward loop which is a common motif in network was under represented in true networks and second double feed forward loop were over represented in some of our true networks. The clustering showed similar results as observed on the boxplots. In fact complex cells type were shown to be clustered together as for “neuron associated cell cancer”, “neurons fetal brain”, “forebain” and “leukocytes” which all had more double feed forward loop than in random networks. These tendencies were confirmed with the removal of non significant values on the second heatmap (figure 5). However the results for single feed forward loops were unexpected and may be an artefact and should lead to further analysis.
Figure 4: On x axis are all 12 three knots’ motifs and in y axis are all 32 true networks. This heatmap shows the z-score of each motifs for each cluster.
Figure 5: On x axis are all 12 three knots’ motifs and in y axis are all 32 true networks. This heatmap shows the z-score of each motifs for each cluster that had a significant p-value after a benjamini hochberg correction for multiple testing.
Conclusion and Perspective:
We saw differences in architecture as well as regulation complexity betweek networks. Those result made sense biologically since neuronal and immunuty networks have to adapt very efficiently depending on the situation. We still have to go further and continue this analysis, there is a lot more to discover.
References
Project by Daniel Marbach, with Hervé Besançon, Boris Schnider, Charles Binder. Daniel Marbach and al. papers


