Difference between revisions of "User:Sbprm2023 olga"
(→Methods) |
(→Methods) |
||
| (23 intermediate revisions by the same user not shown) | |||
| Line 9: | Line 9: | ||
The initial step of the analysis was to carry out a Pearson correlation test to assess the relationship between the different indices. Subsequently, simple regressions were performed to investigate the correlation between the number of comorbidities and the different indices. Further, multiple regressions were conducted, with age and sex considered as variables. A significant interaction between sex and comorbidities determined that sex should be accounted for separately in the calculations. | The initial step of the analysis was to carry out a Pearson correlation test to assess the relationship between the different indices. Subsequently, simple regressions were performed to investigate the correlation between the number of comorbidities and the different indices. Further, multiple regressions were conducted, with age and sex considered as variables. A significant interaction between sex and comorbidities determined that sex should be accounted for separately in the calculations. | ||
The best models were chosen for women and men based on the adjusted R<sup>2</sup>, and analyses were carried out on the chosen comorbidities to ensure that they had all a significant contribution to the model. Then, after checking the validity of the model, the best of the formulas was compared with BMI. | The best models were chosen for women and men based on the adjusted R<sup>2</sup>, and analyses were carried out on the chosen comorbidities to ensure that they had all a significant contribution to the model. Then, after checking the validity of the model, the best of the formulas was compared with BMI. | ||
| − | [[File:Table1.jpeg| | + | |
| + | [[File:Table1.jpeg|600px|thumb|center|'''Table 1:''' The five calculations selected for this research.]] | ||
=== Results === | === Results === | ||
The Pearson correlation test showed that the different formulas were highly correlated with each other, with an absolute correlation between 0.85 and 0.99 for women and between 0.83 and 0.99 for men. Simple linear regressions taking into account the sum of comorbidities and the different formulas all showed a positive correlation between obesity and comorbidities. Multiple linear regression considering each model as a function of age, sex, sum of comorbidities, and interaction between sex and sum of comorbidities showed that the association between obesity and comorbidities was different for women and men, and therefore, it was necessary to separate the sexes for all calculations. | The Pearson correlation test showed that the different formulas were highly correlated with each other, with an absolute correlation between 0.85 and 0.99 for women and between 0.83 and 0.99 for men. Simple linear regressions taking into account the sum of comorbidities and the different formulas all showed a positive correlation between obesity and comorbidities. Multiple linear regression considering each model as a function of age, sex, sum of comorbidities, and interaction between sex and sum of comorbidities showed that the association between obesity and comorbidities was different for women and men, and therefore, it was necessary to separate the sexes for all calculations. | ||
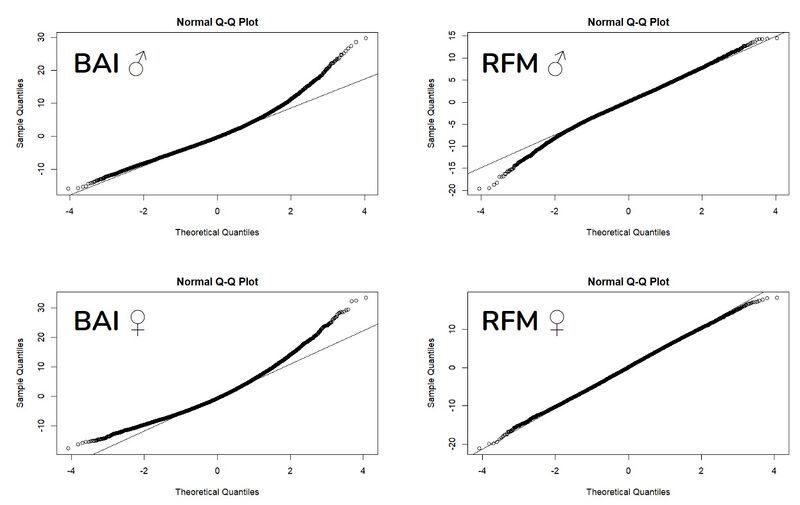
| − | Multiple linear regression, separate for women and men, this time taking into account only age and the sum of comorbidities, was used to determine the models with the best predictability of the obesity measures (i.e. the highest adjusted R<sup>2</sup>). For both women and men, the best models were with the BAI and RFM. For women, the adjusted R<sup>2</sup> was 0.1252 for the BAI and 0.1250 for the RFM, and for men the adjusted R<sup>2</sup> was 0.1319 for the BAI and 0.1328 for the RFM. After testing the validity of these two models, it was shown that the models with BAI did not completely satisfy the assumptions of the linear regression, especially concerning the normality of the residuals ('''Figure 1'''), therefore the RFM has been used for the subsequent analysis. | + | Multiple linear regression, separate for women and men, this time taking into account only age and the sum of comorbidities, was used to determine the models with the best predictability of the obesity measures (i.e. the highest adjusted R<sup>2</sup>). For both women and men, the best models were with the BAI and RFM. For women, the adjusted R<sup>2</sup> was 0.1252 for the BAI and 0.1250 for the RFM, and for men the adjusted R<sup>2</sup> was 0.1319 for the BAI and 0.1328 for the RFM. After testing the validity of these two models, it was shown that the models with BAI did not completely satisfy the assumptions of the linear regression, especially concerning the normality of the residuals ('''Figure 1'''), therefore the RFM has been used for the subsequent analysis. |
| + | |||
| + | [[File:Figure1.jpeg|800px|thumb|center|'''Figure 1:''' Q-Q Plot of residuals of the BAI and RFM for men and women.]] | ||
| + | |||
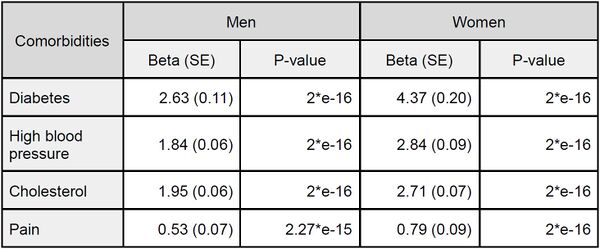
Then, the multiple linear regression used considered age and each comorbidity separately. We removed cancer because it did not contribute significantly to our models. We observed the effect of each comorbidity in explaining the variance of the RFM (see '''Table 2''' for respective effect sizes and P-values). Results of the contribution of each comorbidities indicated that diabetes had the greatest contribution to the model among the various factors in both sexes, followed by high blood pressure and cholesterol, in that order for women and reverse order for men, with similar levels of contribution. Conversely, pain was found to be of lesser importance in this model. | Then, the multiple linear regression used considered age and each comorbidity separately. We removed cancer because it did not contribute significantly to our models. We observed the effect of each comorbidity in explaining the variance of the RFM (see '''Table 2''' for respective effect sizes and P-values). Results of the contribution of each comorbidities indicated that diabetes had the greatest contribution to the model among the various factors in both sexes, followed by high blood pressure and cholesterol, in that order for women and reverse order for men, with similar levels of contribution. Conversely, pain was found to be of lesser importance in this model. | ||
| + | |||
| + | [[File:Table2.jpeg|600px|thumb|center|'''Table 2:''' Beta coefficients, standard errors (SE) and P-values associated with each comorbidity in models with RFM as outcome and age as additional covariate.]] | ||
| + | |||
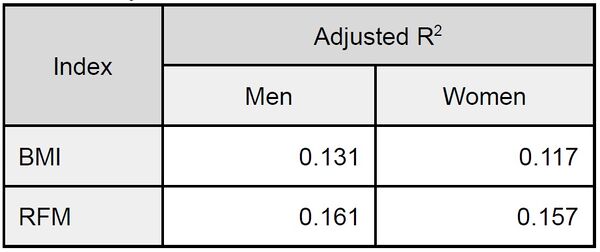
Finally, the adjusted R<sup>2</sup> of BMI and RFM were compared. For women, the adjusted R<sup>2</sup> was 0.117 for the BMI and 0.157 for the RFM, and for men the adjusted R<sup>2</sup> was 0.131 for the BMI and 0.161 for the RFM ('''Table 3'''). | Finally, the adjusted R<sup>2</sup> of BMI and RFM were compared. For women, the adjusted R<sup>2</sup> was 0.117 for the BMI and 0.157 for the RFM, and for men the adjusted R<sup>2</sup> was 0.131 for the BMI and 0.161 for the RFM ('''Table 3'''). | ||
| + | |||
| + | [[File:Table3.jpeg|600px|thumb|center|'''Table 3:''' Adjusted R<sup>2</sup> for the BMI and the RFM.]] | ||
=== Discussion === | === Discussion === | ||
Latest revision as of 10:50, 24 May 2023
Contents
A new measure of obesity
Introduction
Society is facing an increasing issue with obesity, but determining an appropriate threshold for identifying obesity remains challenging. The Body Mass Index (BMI) is the current method used to measure obesity, calculated by dividing weight by height squared. However, this method has limitations, such as underestimating obesity for shorter individuals and overestimating it for taller individuals. Additionally, BMI fails to account for tissue type and distribution. To address these shortcomings, the waist-to-hip ratio (WHR) has emerged as another measurement, taking visceral fat into account, but these measures must be treated differently for men and women. The objective of this project is to identify a new calculation method that can potentially replace BMI while still being feasible to calculate at home. Specifically, the focus is on people whose excess weight has caused health issues, as obesity's main concern is the comorbidities associated with it. It is not necessary to classify individuals as obese if their excess weight does not negatively impact their health.
Methods
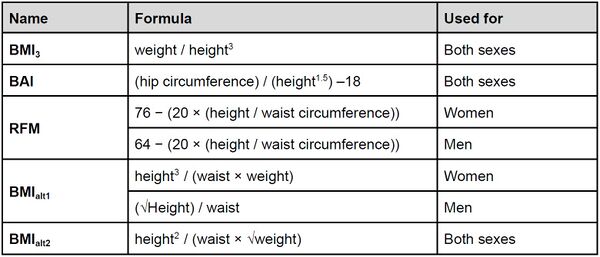
After reviewing various articles1,2,3,4, five calculations were chosen as potentially more accurate than the BMI, with two tailored for either men or women, and three being applicable to both genders (Table 1). Then, five comorbidities of obesity were chosen because their occurrence correlated with excessive weight gain: diabetes, high blood pressure, high cholesterol, knee/back/hip pain and cancer. These variables have been binarized. The analysis was done on ca. 40,000 individuals from the UK Biobank database5. The initial step of the analysis was to carry out a Pearson correlation test to assess the relationship between the different indices. Subsequently, simple regressions were performed to investigate the correlation between the number of comorbidities and the different indices. Further, multiple regressions were conducted, with age and sex considered as variables. A significant interaction between sex and comorbidities determined that sex should be accounted for separately in the calculations. The best models were chosen for women and men based on the adjusted R2, and analyses were carried out on the chosen comorbidities to ensure that they had all a significant contribution to the model. Then, after checking the validity of the model, the best of the formulas was compared with BMI.
Results
The Pearson correlation test showed that the different formulas were highly correlated with each other, with an absolute correlation between 0.85 and 0.99 for women and between 0.83 and 0.99 for men. Simple linear regressions taking into account the sum of comorbidities and the different formulas all showed a positive correlation between obesity and comorbidities. Multiple linear regression considering each model as a function of age, sex, sum of comorbidities, and interaction between sex and sum of comorbidities showed that the association between obesity and comorbidities was different for women and men, and therefore, it was necessary to separate the sexes for all calculations. Multiple linear regression, separate for women and men, this time taking into account only age and the sum of comorbidities, was used to determine the models with the best predictability of the obesity measures (i.e. the highest adjusted R2). For both women and men, the best models were with the BAI and RFM. For women, the adjusted R2 was 0.1252 for the BAI and 0.1250 for the RFM, and for men the adjusted R2 was 0.1319 for the BAI and 0.1328 for the RFM. After testing the validity of these two models, it was shown that the models with BAI did not completely satisfy the assumptions of the linear regression, especially concerning the normality of the residuals (Figure 1), therefore the RFM has been used for the subsequent analysis.
Then, the multiple linear regression used considered age and each comorbidity separately. We removed cancer because it did not contribute significantly to our models. We observed the effect of each comorbidity in explaining the variance of the RFM (see Table 2 for respective effect sizes and P-values). Results of the contribution of each comorbidities indicated that diabetes had the greatest contribution to the model among the various factors in both sexes, followed by high blood pressure and cholesterol, in that order for women and reverse order for men, with similar levels of contribution. Conversely, pain was found to be of lesser importance in this model.
Finally, the adjusted R2 of BMI and RFM were compared. For women, the adjusted R2 was 0.117 for the BMI and 0.157 for the RFM, and for men the adjusted R2 was 0.131 for the BMI and 0.161 for the RFM (Table 3).
Discussion
It was shown that in our database (UK Biobank), the RFM is a better indicator of obesity, especially when considering obesity-related comorbidities, than the BMI. However, further studies should be performed to know if the RFM is significantly more accurate than the BMI. Moreover, the BMI is currently used all over the world. Before thinking of replacing it, it would be necessary to ensure that the RFM is as precise on all the ethnic groups of the world. Indeed, the UK Biobank database under-represents a large proportion of ethnicities. Finally, BMI is a simple calculation that everyone knows and that is common for everyone, so it can be difficult to get into the habit of using a new calculation that is a bit harder to remember than the BMI but with the online calculators this problem is easily solved.
References
- Keys, A., Fidanza, F., Karvonen, M. J., Kimura, N., & Taylor, H. L. (2014). Indices of relative weight and obesity. International journal of epidemiology, 43(3), 655–665.
- Richard, N. B., Darko, S., Thomas, A. B., Anne, E. S., James, C. R., Nancy, G. S., Anny, H. X, & Richard M. W. (2012). A Better Index of Body Adiposity. Obesity a research journal, 19(5), 1083-1089.
- Woolcott, O. O., & Bergman, R. N. (2018). Relative fat mass (RFM) as a new estimator of whole-body fat percentage ─ A cross-sectional study in American adult individuals. Scientific reports, 8(1), 10980.
- Burton R. F. (2007). Why is the body mass index calculated as mass/height2, not as mass/height3?. Annals of human biology, 34(6), 656–663.
- https://www.ukbiobank.ac.uk


