Difference between revisions of "Software"
| Line 1: | Line 1: | ||
| + | |||
| + | |||
[[Category:Homepage]] | [[Category:Homepage]] | ||
| + | |||
| + | In addition to studying biological systems through mathematical modeling and analysis of large-scale data sets, the Computational Biology Group also develops tools and methods for such analyses. Like other research groups in the field, we make the software implementation of those methods freely available to encourage their use and comparison with other methods. | ||
| + | |||
| + | |||
| + | |||
| + | == [[Metabomatching]] == | ||
== [[ISA|The Iterative Signature Algorithm]] == | == [[ISA|The Iterative Signature Algorithm]] == | ||
| Line 28: | Line 36: | ||
'''[[ExpressionView|See more here]]''' | '''[[ExpressionView|See more here]]''' | ||
| + | |||
| + | |||
| + | == [[Cellophane]] == | ||
Revision as of 15:38, 20 March 2015
In addition to studying biological systems through mathematical modeling and analysis of large-scale data sets, the Computational Biology Group also develops tools and methods for such analyses. Like other research groups in the field, we make the software implementation of those methods freely available to encourage their use and comparison with other methods.
Metabomatching
The Iterative Signature Algorithm
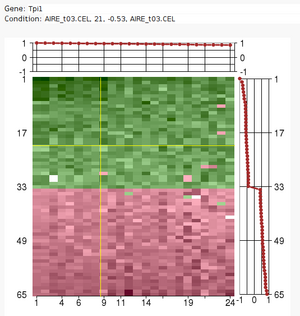
Large sets of data, like expression profile from many samples, require
analytic tools to reduce their complexity.
The Iterative Signature Algorithm (ISA) was designed to reduce the
complexity of very large sets of data by decomposing it into so-called
"modules". In the context of gene expression data these modules consist of
subsets of genes that exhibit a coherent expression profile only over a
subset of microarray experiments. Genes and arrays may be attributed to
multiple modules and the level of required coherence can be varied resulting
in different "resolutions" of the modular mapping. Since the ISA does not
rely on the computation of correlation matrices (like many other tools), it
is extremely fast even for very large datasets.
See more here
ExpressionView
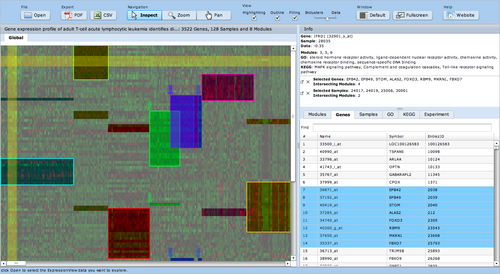
ExpressionView is an R package that provides an interactive environment to explore biclusters identified in gene expression data. A sophisticated ordering algorithm is used to present the biclusters in a visually appealing layout. From this overview, the user can select individual biclusters and access all the biologically relevant data associated with it. The package is aimed to facilitate the collaboration between bioinformaticians and life scientists who are not familiar with the R language.

