Difference between revisions of "File:Graphe Martin.png"
(Data visualization) |
(→Summary) |
||
| Line 1: | Line 1: | ||
== Summary == | == Summary == | ||
| − | Data visualization | + | Data visualization: |
| + | |||
| + | Distribution of the weight of the mice according to the combined genotype. a, boxplot of the distribution by genotype. b, density plot of the distribution by genotype. c, boxplot of the distribution by cage (boxes of the same color represent cages where we find mice of the same genotype). | ||
Latest revision as of 10:43, 3 June 2024
Summary
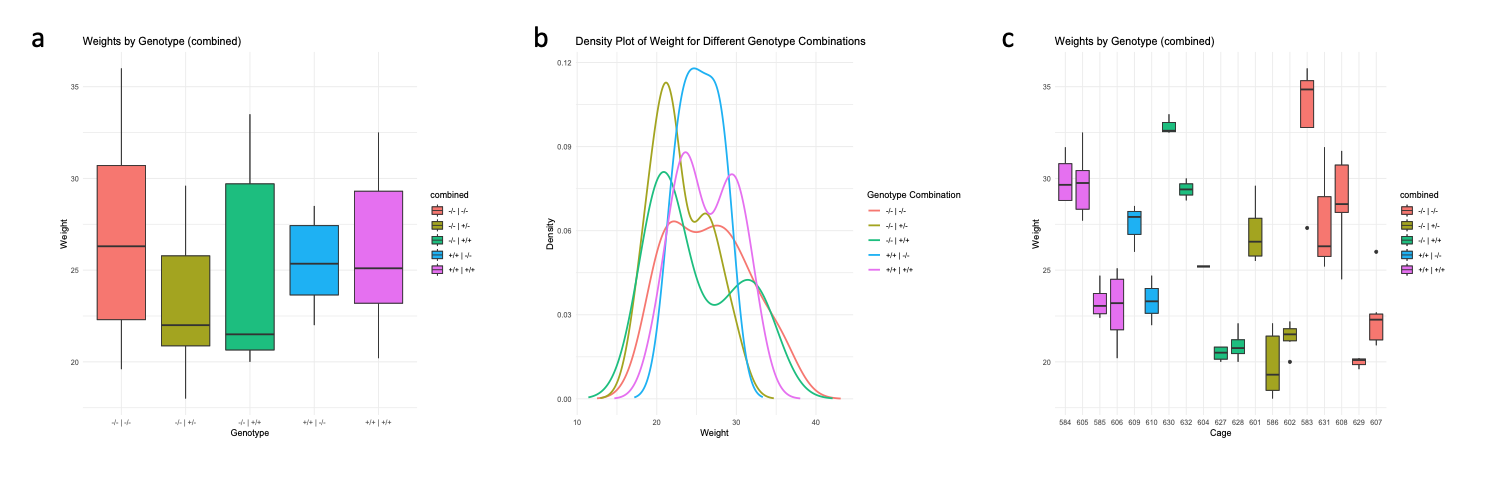
Data visualization:
Distribution of the weight of the mice according to the combined genotype. a, boxplot of the distribution by genotype. b, density plot of the distribution by genotype. c, boxplot of the distribution by cage (boxes of the same color represent cages where we find mice of the same genotype).
File history
Click on a date/time to view the file as it appeared at that time.
| Date/Time | Thumbnail | Dimensions | User | Comment | |
|---|---|---|---|---|---|
| current | 10:32, 3 June 2024 | 1,488 × 500 (122 KB) | Biomath2024 2 (talk | contribs) | Data visualization |
- You cannot overwrite this file.
File usage
The following page links to this file: