Polygenic Risk Scores
- Project name: Polygenetic Risk Score (PRS)
- Tutor: Alex Button (alexanderluke.button_AT_unil.ch)
- Slides: File:Polygenetic Risk Score.pdf
Contents
Introduction
Definition
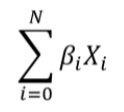
Polygenic Risk Score or PRS is the calculation of a risk score from the subject's genome with the weighted sum of the SNPs to estimate the risk that the subject will develop a certain disease or trait according to the changes linked to the phenotype studied. There are two main factors that we use to calculate the PRS: the allelic dosage (Xi), which represents the number of copies of the main effect allele and can be 0, 1 or 2. And the other factor is the effect size (βi), which measures the strength of the relationship of a trait with the allelic dosage at a position i on a numeric scale.
Jura & UK Biobank
In order to have data, we used Jura, which is a cluster for analysis of sensitive data and is primarily used by the CHUV. We need to have authorization to use Jura, but like that we can have real subject’s data.And there are data coming from the UK Biobank, which is a large-scale biomedical database and research resource, containing genetic and health information from half a million UK participants that is enabling new scientific discoveries to be made that improve public health.
Our goal with this project
Our goal is to compare the polygenic risk score that we found for the SNPs of the different BMI indices from group 1. And if possible make connections and correlations with diseases.
Why is Polygenic Risk Score important ?
The Polygenic Risk Score is used for disease outcome prediction. It indicates the relative risk for the disease or trait studied, compared to other people with different genomes at an individual level. But we must be careful with the results, because it gives us correlations and correlations are not equal to causations. There are other factors that are not necessarily considered, such as the environment. Nevertheless it can be useful, for example: the riskiest people can be prepared and can take predispositions with their doctors. However, it will be more accurate for some people. For the moment, the use of PRS is not widespread, because there are no guidelines, and it is still in process of improvement. It will always be probabilities and not certitudes. Despite the statistics behind it, PRS could potentially be very powerful to “simply” predict (at birth) all kinds of diseases one could encounter. It is still a bit early for that, but it could help people in the future.
Methodology
(text)
Results
Group 1 GWAS
Conclusion
Back to our goal and question
Our initial plan for the project was to do a PRS on the BMI results made by group 1. We wanted to look at different PRS results from their different BMI indexes and potentially get interesting results. The issue we got is that when we did our first analysis for their default BMI index, it didn’t look that great. We then tried for the other indexes but there again the PRS distribution wasn’t too crazy as you saw before. We weren’t sure why that was the case, it could either be an issue with the data, like how it was collected, the threshold used etc. or it could’ve simply been due to our code that was doing something wrong.
So, to better understand what was going wrong we took data from an already published study that basically did the same thing we were trying to do, and did a polygenic risk score on it. As you just saw, it worked fine so our code wasn’t the issue (props to you Didier). Now, we still don’t know why it didn’t work before but we still had to complete our analysis, so for that we still made use of the results from group 1 as well as the ones from the published study.
To answer our question of can PRS be used to predict disease outcome, we used the Pearson correlation as a predictive measurement. We found 6.1% for group 1 and almost 9% for the study. These don’t look that high but when comparing to what the published study found, that is 10.4%, it’s actually quite close. So our analysis using PRS was quite accurate to predict disease outcome.
