Robust inference of gene regulatory networks using bootstrapping
Background: Genome-scale inference of transcriptional gene regulation has become possible with the advent of high-throughput technologies such as microarrays and RNA sequencing, as they provide snapshots of the transcriptome under many tested experimental conditions. From these data, the challenge is to computationally predict direct regulatory interactions between a transcription factor and its target genes; the aggregate of all predicted interactions comprises the gene regulatory network. A wide range of network inference methods have been developed to address this challenge. We have previously organized a competition (the DREAM network inference challenge), where we rigorously assessed the state-of-the-art in gene network inference (see our paper to learn more). However, robustness of predictions to variability in the input data has so far not been characterized.
Goal: The aims of this project are to: (1) investigate the performance robustness of top-performing network inference methods from the DREAM5 challenge to variability in the input data, (2) improve the quality of predicted networks using a bootstrapping approach, (3) generate an improved prediction for the transcriptional regulatory network of E. coli and analyze its structural properties.
Mathematical tools: This project has a computational flavor. Students will familiarize themselves (at a high level) with gene network inference approaches, ensemble based approaches in machine learning (bootstrapping, bagging), and basic network properties such as degree distribution. A programming environment such as R or Matlab will be used. Network inference tools may have to be run from the command line (Unix console).
Biological or Medical aspects: The students will predict and analyze a genome-wide transcriptional regulatory network for E. coli.
Slides: Project introduction slides (pdf)
Supervisor: Daniel Marbach
Students: Laure Décombaz, Sashka Kauffman, Yosra Zhang
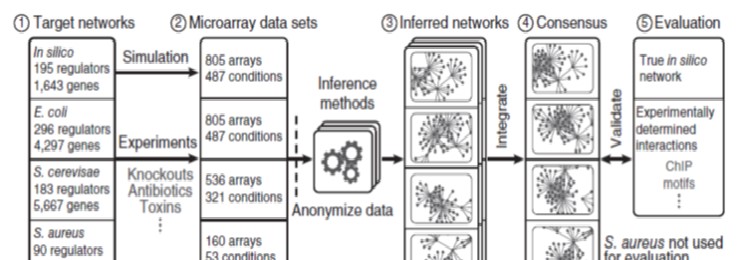
Backgroung : Our project is based on the data used in the "Dream challenge" (In vivo, E.coli,...) and on the method used by the teams having done the best predicted networks : bootstrapping!
Here is a summary of what these teams have done:
Microarray data (expression data of E.Coli,...)-->Bootstrapping-->Inference methods-->Predict networks

Goals : The best teams of the Dream challenge were using bootstrapping so we want to go further in the exploration of this method.
This is why our goals are:
To see if the performance varies when we
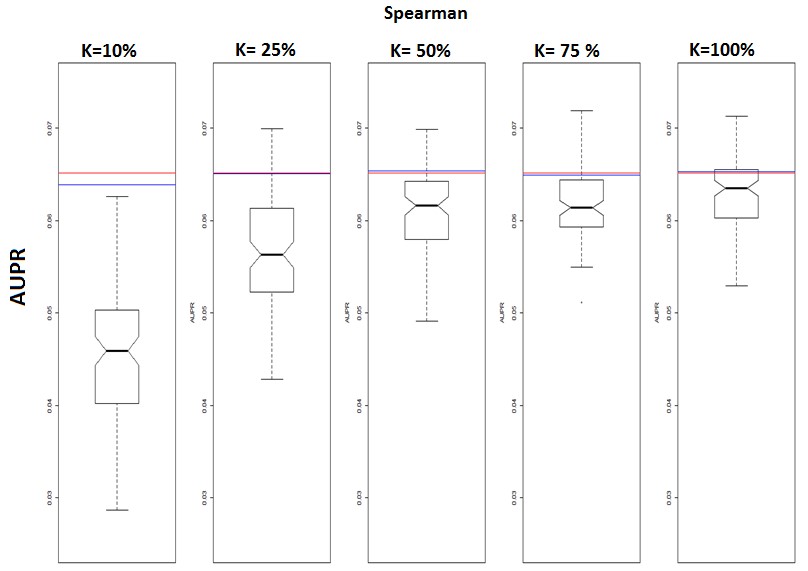
1) change the fraction of the data used for the bootstrap runs
2) change the number of bootstrap runs
3) change of inference methods
Inference methods used to reach our goals : - Correlation - Multiple regression
Precision recall curve : To evaluate the performance of making bootstrap runs with different inference methods,... we have to create a plot in R with the precision in the vertical axis and the recall in the horizontal axis. Here are the functions: Recall = TP(k)/P where TP(k) are the true positif of our first k edges of the list and P are the positif of all the list. Precision = TP(k)/TP(k)+FP(k) = TP(k)/k
Results :
1) Performance with different K fractions :

2) Performance with different number of bootstrap runs :

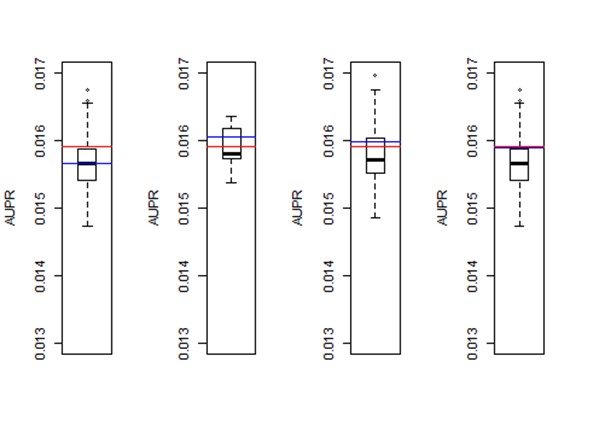
To obtain these results we used the network 3 which corresponds to E.coli ,we took 30% of this network and we had the correlation of Spearman as method for each bootstrap run. The only changing factor was the number of bootstrap runs.
In the first boxplot we made 5 bootstrap runs, in the second 10, the third 50 and the last 100.
Our vertical axis is the "aupr" (area under the precision recall curve) that indicates the performance. (the precision in the prediction of our network)
The red line is the performance when we take all the data without bootstrapping.
The blue line is the performance of the consensus network and the thick black line is the performance of our midpoint (it's the average performance of all our individual predicted networks).
In each boxplot we can notice the consensus is higher than the black line. It means the performance of our consensus is better than the performance of the individual networks.
When the performance of the consensus is higher than the performance whe we use all the data (blue line higher than the red line) it means the bootstrap improve the performance. It seems to be the case for the boxplot 2 and 3 but in fact these results are just random results because it's noisy. For example when we take 10 times 30% of our data at random, we can be lucky and obtain 10 pretty good results and so the blue will be above the red line or we can be unlucky and obtain 10 bad results and so the result will be the opposite (the blue line under the red line).
The only thing we can be sure is that the consensus tends toward the red line when we increase the number of bootstrap runs.
In conclusion quickely the performance of our consensus is the same as the performance when we take all the data.
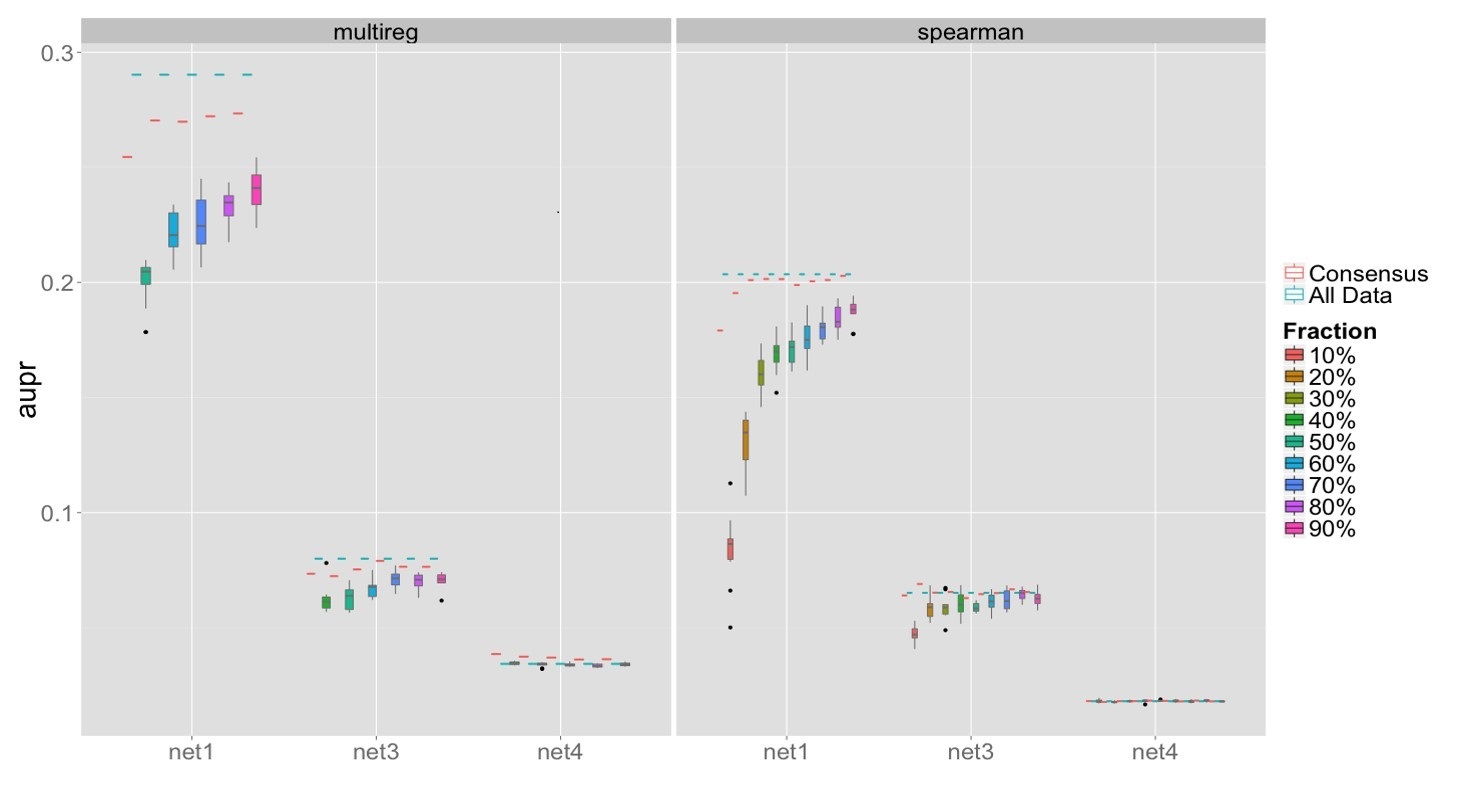
3) Performance across different networks and inference methods :

conclusions : - Bootstrapping doesn't improve the performance in comparison of the performance when using all the data when we use different inference methods or different fractions or different number of bootstrap runs.
-Consensus improves over individual bootstrap runs, but does not improve compared to using all data for the tested methods (Spearman and multiple regression).
- When we increase the number of bootstrap runs the performance using all the data (without bootstrapping) is the same as the performance of the consensus network.
Further exploration : We could see if the performance varies using different inference methods (svm,Lasso,random forest,...) when we bootstrap the data.