Sex differences in retinal vascular properties
Ilou Lejeune, Emma Walsh, Juliette Despres
Supervisor: Leah Bötgger
Sex differences in retinal vascular properties
With a focus on diabetes
Introduction
Type 2 diabetes is a disease that occurs when insulin cannot be used, due to the depletion of pancreatic β cells. As a result, glucose cannot go into the storage tissues and remains in the blood. Many diseases are associated with diabetes, such as diabetic retinopathy, cardiovascular diseases, stroke, and hypertension. Risk factors for type 2 diabetes include body mass index (BMI), age, inactivity, family history, and blood lipid levels. Low levels of high-density lipoprotein (HDL) and high levels of low-density lipoprotein (LDL) are associated with diabetes risk. High levels of triglycerides are also a risk factor for diabetes.
There are differences in diabetes between men and women, primarily based on metabolic differences between the sexes. There is a higher prevalence of diabetes in males, but females are more likely to experience vascular complications. This knowledge prompted our study to focus on diabetes in the context of sex differences in vascular retinal properties.
The goals of this project were to (1) explore differences of Image-Derivate Phenotypes (IDPs) of the retina between males and females and (2) study the association of IDPs with diabetes and other risk factors.
This research is important in the context of fundus screening, a technique that could become an additional or alternative screening method for diabetes. Fundus screening is advantageous because it is timely, inexpensive, and accessible. It could be used to improve patient outcomes, give an early and accurate diagnosis, and allow for the monitoring of disease progression. In that way, treatments plans could be done more on a case-by-case basis.
Methods
This study used data from retinal fundus images collected by the UK BioBank. There was a total of 81,859 retinal images used, with 38,200 males and 43,659 males. At UNIL, these fundus images were used to extract image derived phenotypes or IDPs. There were 17 IDPs measured. Examples of IDPs include vein tortuosity, artery tortuosity, vascular density, and many more.
Four covariates were selected for further analysis in this project: BMI, HDL, LDL, and triglycerides. These covariates were chosen as they are risk factors for diabetes and are an interest of study in the context of diabetes.
Several statistical methods were used for this project. Firstly, explorative statistics were done to gain an understanding of the types of data, number of samples, definitions of IDPs, and the prevalence of diabetes in men and women separately. Next, the IDPs have been Z-scored and t-tests and correlation analyses were completed to explore the different IDPs in each sex and visualize the differences between sexes. Regression analysis was the last method. Diabetes was looked at as a binary variable and a logistic regression was completed. Linear regressions (Ordinary Least-Square method) were looked at for the other variables as they are continuous. We used four confounding factors for our regression analysis: the age of recruitment, spherical power, cylindrical power, and the assessment center.
Formula: Risk factor ~ IDP + sex + IDP*sex + confounding factors
For each risk factor, we performed 17 tests with one of the IDPs at the time. We performed a Bonferroni adjustment for multi-test. We are mainly interested in the IDP-sex interaction.
Results
Our initial findings show that there is a higher number of men have been diagnosed with diabetes, with the distribution of age at diagnosis being quite similar between men and women.
Through t-tests, it was found that 16 of the 17 IDPs have significant differences between males and females. Only one of the IDPs, eq_CRVE, was found to not have a significant difference between sexes.
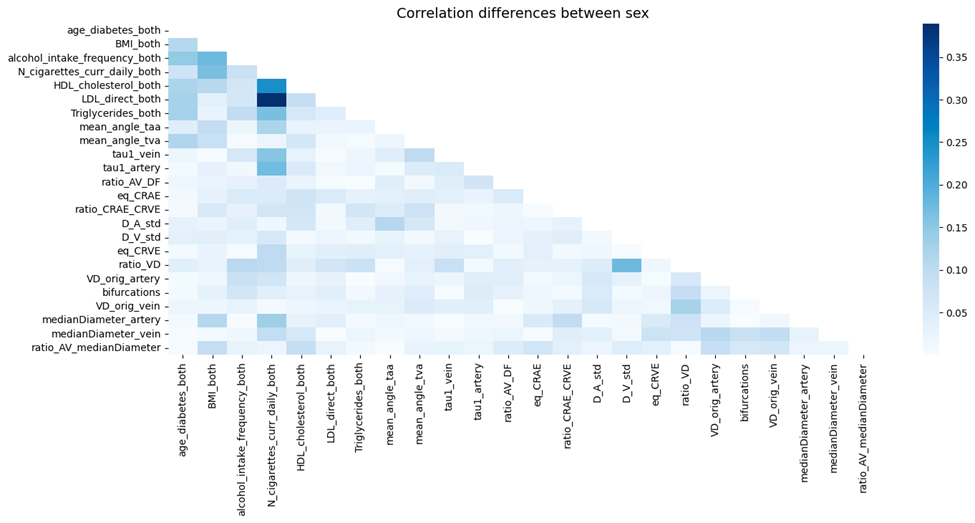
Correlation matrices were done for males and females for the 17 IDPs as well as some covariates. Subtracting the correlation matrix of females from the correlation matrix of males, we could see the differences in correlation. It was found that several IDPs and covariates showed a difference. This allowed us to understand the differences in correlation between sexes and stimulated us to continue analysis.
Figure 1: Correlation differences for the 17 IDPs and other traits. To obtain this matrix, we subtracted the correlation matrices for men and women, taking only the absolute value for a better visualization of the differences.
With the four covariates that were selected to explore, distributions were visualized while separating males and females. HDL has the greatest difference in distribution. The other covariates also showed differences, but they were not as notable.
Figure 2: Distributions of the associated risk factors.
The regression analysis revealed various traits to have a significant interaction with sex when predicting the risk factor. Some traits were shared for multiple risk factors where a few were exclusive to a single risk factor. Amongst the traits that were common to at least two risk factors we found vessel (both arteries and veins) mean diameter and vascular density, as well as the vessels bifurcations. We’ll look at each risk factor:
Triglycerides:
Vascular density of arteries and veins, mean diameter of arteries and veins, bifurcations, and the vein central retinal equivalent.
Low-Density Lipoprotein:
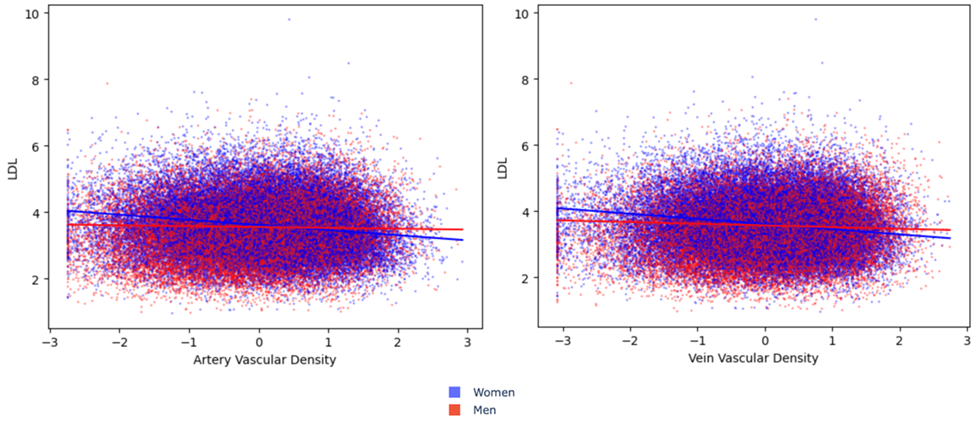
Vascular density of arteries and veins, mean diameter of arteries and veins, standard deviation of the diameter of arteries and veins, bifurcations, and vascular density ratio.
Figure 3: Graphical representation of the linear regression for LDL with the vascular density of the arteries and veins (Z-scored).
High-Density Lipoprotein:
None. Bifurcations revealed significant, but with a significant impact of the assessment centers confounding factor.
Body Mass Indicator:
Tortuosity of the veins.
Diabetes diagnosed:
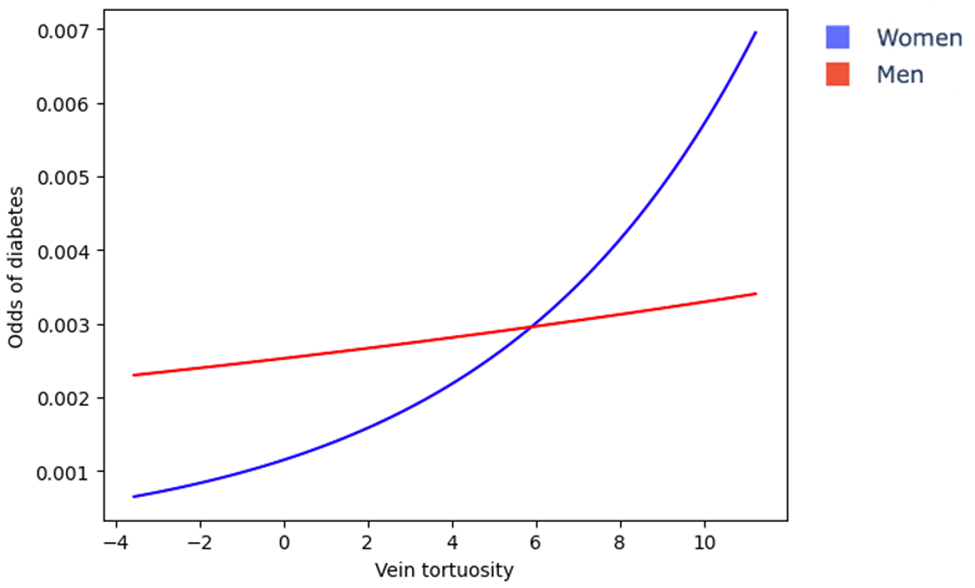
Tortuosity of the veins.
Figure 4: Graphical representation of the differences in diabetes odds related to the veins’ tortuosity (Z-scored) for male and female.
It is worth mentioning that in almost all cases, age had a significant impact. However, it was only the age of recruitment, and not the age at which the patient had diabetes diagnosed. Additionally, spherical or cylindrical power had in a few cases a significant impact as well.
Conclusions
Overall, our different results showed several differences in diabetes between men and women. Moreover, the results of this regression analysis showed that some IDPs have an interaction with sex when predicting risk factors associated with diabetes. However, the results also highlighted different traits to have an interaction with sex for the different associated risk factors and diabetes. Another interesting result lies in the differences of diabetes odds when the veins’ tortuosity is at the mean of sample. It seems that when the vein tortuosity is equal to the mean, female individuals have lesser odds of diabetes than male individuals.
This project confronted us with different challenges. For example, we had binary or continuous variables, and we didn’t know at first how to consider them and create something that makes sense. Also, we had to work with a lot of different variables: with diabetes, the 17 IDP’s, sexes, diabetes... It was hard to consider everything and make something consistent, because we could have gone in so many different directions, do so many different plots with many different covariates.
The analysis of the data was sometimes difficult also, as for the HDL, when we found significant differences between sexes but nothing relevant when we plotted it. We realized afterwards that there were significant differences between all assessment centers. So, in that way, results were biased, and we couldn’t get anything out of this. For each covariate that we used, we wanted to split the data between male and female and see if there is a difference between traits in diabetes. But for HDL also, we couldn’t find something relevant. This could be explained by the fact that some samples were not complete and were too small: this led to background noises and less statistical power, that enables us to conclude anything.
If we had more time, we could have gone in so many different directions to analyze this database. But first, we could have looked at other confounding factors such as smoking and alcohol which are known to be risk factors for diabetes. Also, we could have looked at right, left and both eyes separately, because it is well known that there is a link between the eyes and diabetes. Moreover, we could have split the database into age categories.
Course Feedback
We want to thank our assistant Leah for the immense guidance during this project! The overall course and project were engaging and something different than what we have been learning in other courses. This project was a good introduction to data analysis. We were challenged while doing this analysis using Python, but it also allowed us to learn and improve a great amount.


