![]() Pleiotropy of genes is often the main solution to explain genetic basis of complex phenotypes (i.e., those composed of multiple traits). But dissection of those genes or loci are rarely studied, and it remains unclear which of single pleiotropic mutations or multiple mutations with independent effects are responsible to elaborate complex phenotypes.
Pleiotropy of genes is often the main solution to explain genetic basis of complex phenotypes (i.e., those composed of multiple traits). But dissection of those genes or loci are rarely studied, and it remains unclear which of single pleiotropic mutations or multiple mutations with independent effects are responsible to elaborate complex phenotypes.
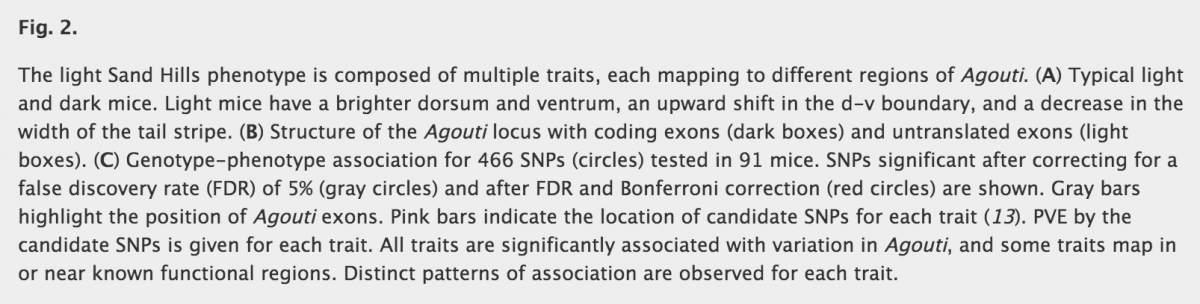
Linnen et al. are interested in coloration of the deer mice (Peromyscus maniculatus) present on the light-colored soils of the Nebraska Sand Hills. Adaptation for crypsis is the strongest hypothesis to explain prevalence of the light morph compared to the black morph, and they wanted to dissect the genetic basis of this adaptation. This study is composed of two main parts : first to understand and to evaluate the complexity of coloration phenotype and then to find the mutations responsible of those variation in traits and on which morph selection is acting on. First of all, they implemented an experimentation with plasticine models to count the number of attacks on each coloration morph. As they expected, statistical test reveals that the dark models are significantly more attacked than light models. Closer inspection reveals multiple pigmentation traits and pattern that differ between the light and the dark morph to compose complex coloration phenotype (particularly for dorsal hue and brightness, ventral color, dorsal ventral boundary and tail stripe). In previous study, they found that recent change in dorsal fur to light color is mainly caused by a change at the Agouti locus.
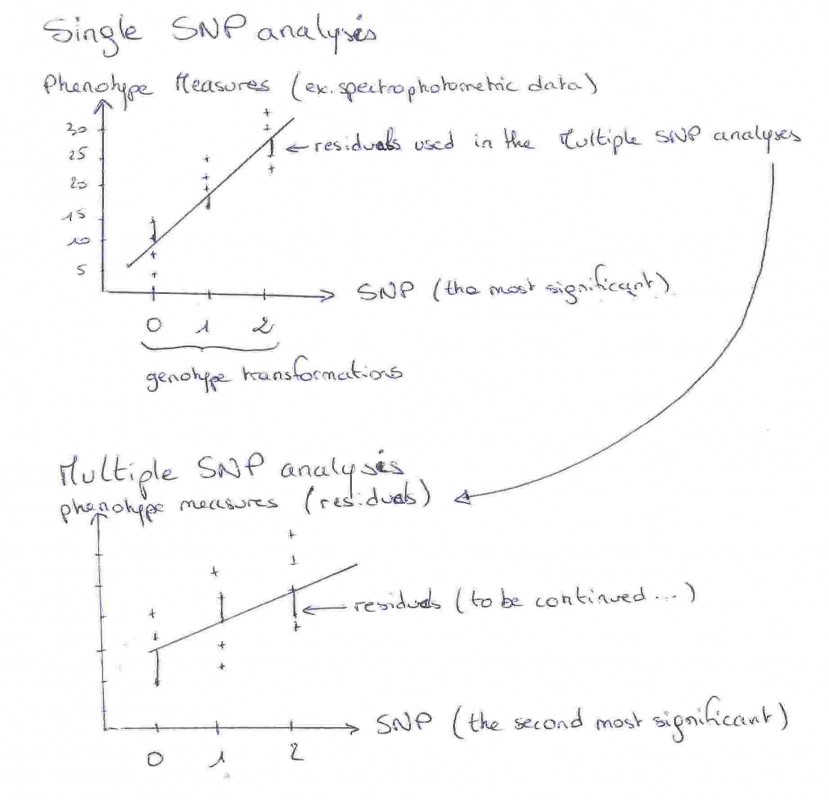
Before looking at point mutation in this locus, they wanted to see if color and color pattern are, or not, dependant. Principal component analysis (PCA) reveals that the phenotypes in this wild population were largely independent suggesting multiples independent genetic control. To test this hypothesis, they used NGS to generate polymorphism data for ~2100 unlinked regions and a smaller region containing Agouti and all known regulatory elements. Single-SNP linear regressions allowed first to find which mutation is associated with the different color traits. Then, using the residues of those regressions, multiple-SNP analysis are done with the other SNPs to look for dependent effect of mutations. We must keep in mind that choice of SNP for the first and the following regressions matters (see explanation in figure 1). Their results are really interesting as they find that most of the color traits are associated with a unique set of SNPs (except for one deletion associated with both ventral color and tail stripe), and that no single set of polymorphisms could account for variation across the five traits. Most interestingly, many of those SNPs fell in or near regions containing regulatory elements suggesting that multiple molecular mechanisms are involved in color adaptation in these Sand Hills mice.
One remark can be made about figure 2 panel C of the article, as it is difficult to see differences between the gray and white circles. Or it is something important as the gray circles represent significant SNPs after correction of false discovery…. It is important to note that no gray circles are found for ventral color trait, and that only one red circle is found (significant SNP after false discovery and bonferroni correction). Moreover, PVE (percent of variation of traits explain by SNPs) is 16%, which the smaller value of all traits. This could mean that this trait variation could be under control of other genes that were not sequenced here.

Which lead them to answer the two questions:
- Does single mutation have pleiotropic effect?
The response is mainly no.
- Do mutations have small and independent effects?
The response is yes, with SNPs falling in coding and non-coding (regulatory elements) regions.
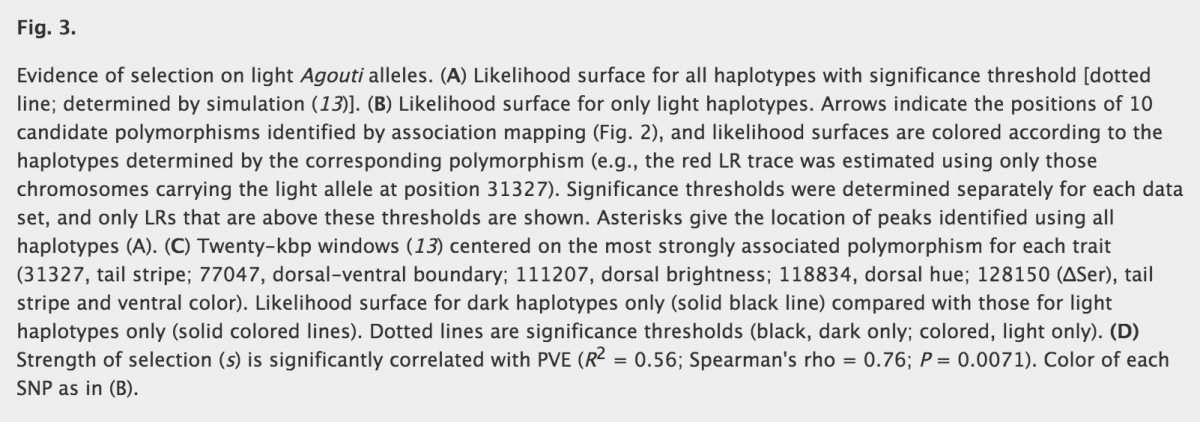
It is useful now to test for positive selection on Agouti and SNPs. To do so, they compare a neutral model to a model with selection (created after calculating a coefficient selection) using simulations and a likelihood ratio test. The neutral model is a demographic model that they previously built using dadi. Also in figure 3 panel A, the simulations are done using all haplotypes, but because sweep (recent mutation) is supposed to be associated with light phenotype only, it is important to restricted the simulation after removing the dark haplotypes. On figure 3, y-axis corresponds to values of likelihood ratio (LR). Bigger the values of LR are (big peaks), less the models fit to each other. Also, when LR value is around 0 there is no departure from neutral model to the model under selection. Finally, as you can see on panel B and C, peaks are much more numerous and bigger when restricted to light alleles. Also, panel C is interesting as it zooms on the most strongly associated polymorphism for each trait, and helps to compare results from dark and light morphs (black line = dark haplotypes, colored line = light haplotypes). Peaks in panel B are found to be significant and clustered around the location of SNPs, which is consistent with recent selection acting on, or near, color-associated SNPs in light haplotypes. Finally, results from a comparison between dark and light-associated alleles are concur with multiple targets of selection among the light, but not dark, alleles of Agouti. Last but not least, strength of selection analysis reveal that selection coefficients (estimated using a maximum likelihood approach) are greater in traits linked to light allele compared to traits of dark allele. For example, for d-v boundary traits, selection coefficient s is 0.42 for light allele, and 0.067 for dark allele. Values of s in dark-associated alleles are really small compared to the light-alleles. Moreover, there is a positive correlation between PVE values (percent of variation of traits explain by SNP) and selection coefficient s across all light associated SNP.

To conclude, their results are finally consistent with Fisher geometric model of adaptation. Small and independent effects of mutation can lead to a more important pleiotropy of a gene (as here with agouti locus leading to complex coloration in the deer mice of Nebraska). Finally, Linnen et al. want us to remember that it is individual mutations, not genes that bring population closer to its phenotypic optimum.
From my point of view this Science letter is well written, clear and concise to answer a question that have important impacts in evolutionary biology. A deeper look allows the reader to appreciate the complexity of the issue and the good work done by those researchers.
Linnen, C., Poh, Y., Peterson, B., Barrett, R., Larson, J., Jensen, J., & Hoekstra, H. (2013). Adaptive Evolution of Multiple Traits Through Multiple Mutations at a Single Gene Science, 339 (6125), 1312-1316 DOI: 10.1126/science.1233213