HMM based classification for conserved SNARE protein domains
Contents
Credits
By Marius Audenis, Leana Ortolani and Gabriel Chiche
Supervisor: Carlos Pulido Quetglas
Click here to access the Github repository of the project.
Click here to here download the powerpoint presentation
Introduction
The proteins of the SNARE family play a role in membrane fusion and can be involved in several processes such as neurotransmission. All of these proteins share a common motif, which we call SNARE. This motif is essential to form the SNARE complex, which mediates the fusion between a vesicle and a target membrane.
This protein family has already been classified into four main groups (Qa, Qb, Qc, R) which are also divided into subgroups. This classification informes about the function ans sub-cellular localization of the protein.
In this project, we aim to build an algorithm capable of automatically classifying a SNARE sequence, thus giving rapid and accurate insights about its function. The classification method will be based on HMM profiles. We will build one HMM per class, and new sequences will be aligned to each of the HMM profiles. Each profile will output a score, quantifying the likelihood of the sequence being generated by the HMM, and an e-value, representing the statistical significance of the score. The new sequence could already be classified based on those values, but in order to reduce the error-rate of the HMM profiles, the e-value and score of all of them will be stored in a vector which will be input to a random forest model. Based on those results, it will be able to improve the classification, yealding a better accuracy (more than 5% in some cases). The final product will be a pipeline that takes a sequence as input, then determines its main group, and then determines the subgroup based on this result.
Building and using the HMM profiles
HMM profiles are a probabilistic representation of a group of sequences capable of characterizing the conserved as well as the variable regions.
Building the HMM profiles
As we wanted to classify proteins into groups and subgroups, we had to build an HMM profile for each group and each subgroups. HMM profiles are built based on multiple sequences alignements (MSA) so that they can differenciate variable and conserved regions. Thus, we had to build one alignement per group and subgroup. The sequences we used were all found in Tracey, the SNARE proteins database of the Dirk Fasshauer group at University of Lausanne.
For the main groups, we used the classification that was already present on the Tracey database. However, we added a fifth group to the main groups, the Snap group. This group is normally considered as a subgroup of the Qb and Qc families, because proteins of this group contain both a Qb and a Qc motif. Thus, if we first wanted to build HMM profiles only for the four main groups, they would have misclassified proteins with Snap motifs as they would have high scores for both Qb and Qc HMM profiles. However, building an HMM profile for proteins with a Snap motif only is a way to make it more accurate as it will be trained to detect both motifs and not only one.
For each group, we downloaded a fasta file containing all of its sequences and used a software called MAFFT to build the MSA. However, before building the HMMs, we cleaned the MSAs by applying a threshold that deleted every position where there was more than 80% of gaps across all the sequences of the group. After that, we checked that the domains had not been deleted by the threshold by verifying that the SNARE and Habc domains were still complete in the human sequences present in the alignements. We used human sequences because for this quality check because they are the most well studied, and the information regarding the SNARE and Habc domains were found on the Tracey database. This filtering step reduces the noise in the HMM profiles that would have been due to the important number of gaps present in the MSAs, thus increasing the accuracy of the HMM profiles. Finally, we used a software called HMMER to build the HMM profiles based on the MSAs.
For the subgoups, we based the classification on the phylogeny. To do this, we built a tree for each main group using the average linkage method, based on MSAs that were not tresholded to keep the maximum amount of information. All the clearly separated branches were defined as a subgroup. After that, we checked if the composition of the subgroups corresponded to the already existing classification in the article An Elaborate Classification of SNARE Proteins Sheds Light on the Conservation of the Eukaryotic Endomembrane System by Dirk Fasshauer, Tobias H. Kloepper and C. Nickias Kienle, which is based on the cellular location of the proteins. In general, the phylogenic classifiaction corresponded to the already existing classification, except that there were some branches containing only fungi sequences of some subgroups. We hypothetsized that this is due to the fact that the membrane of fungi is different than the membrane of metazoa and archeaplastida, which would explain why they sometimes tend to cluster together in trees. Thus when a subgroup is differs a lot for fungal proteins, our classifier will be able to tell if it is a fungal protein or not.
After we had determined the different subgroups, we built one MSA per subgroup. This time, we decided not to apply a treshold because as sequences of a subgroup are more similar, there is already less noise and removing gaps would mean removing important information, which would make the HMM profiles less accurate. We finally built the HMM profiles based on the MSAs using HMMER.
HMM profiles performance
HMM profiles can already perform classification of a sequence. By aligning a new sequence to each class-specific HMM, the model outputs a score and an e-value for each alignment. A sequence classification can already be done by the HMM profiles alone. This is achieved through aligning a sequence to each class-specific HMM. Then the model will produce two outputs for each alignment: a score and an e-value. The score quantifies how probable it is for the given sequence to have been produced by that particular HMM, hence higher scores denote more accurate alignments. On the other hand, an e-value represents the significancy of the score, therefore a lower e-value indicates less likelihood of the match occurring by chance. Thus, to classify a sequence, we could just select the profile that yealded the most significant e-value.
For example, we can see on this image, representing the confusion matrix for the HMM based classification of the Qc subgroups, that this approach is already quite powerful, with an accuracy of 92% in this case. However, there is still room for improvement, and that is why we used a random forest approach to improve the results.
Random forest
A random forest is an ML classification algorithm that builds multiple decision trees and averages their predictions to improve accuracy and reduce overfitting. We used this method to improve the results of our HMM profiles.
Building and training the random forest model
To do this, we trained a random forest model on a matrix where each row represented a sequence and the columns contained the e-values and score divided by length ratio for each HMM. There was also one row containing the true group of each sequence. This way, the model would mostly learn to select the HMM profile yealding the highest score divided by length ratio and lowest e-value, and we hoped that it would also be capable of correcting errors by being able to account for both the score divided by length and e-value, and also being fed the context of the other HMM profiles results.
Before training the model, we had to account for NaN values in the training matrix. Indeed, the HMM scoring can yeald no results when the results are too bad, so we had to fill the gaps for those cases. We decided to replace missing score/lengths by 0.01 as lower score divided by length represent less chances that the profile generated this sequence and we replaced missing e-values by 0.9 as higher e-values represent a less significant match. We built one matrix for the main groups classification and trained a random forest on it. Then, for the subgroups classification, as it was dependent on the main group classification, we built one matrix per main group and thus trained one model per main group, that would be capable of differentiating between the subgroup
Random forest performance
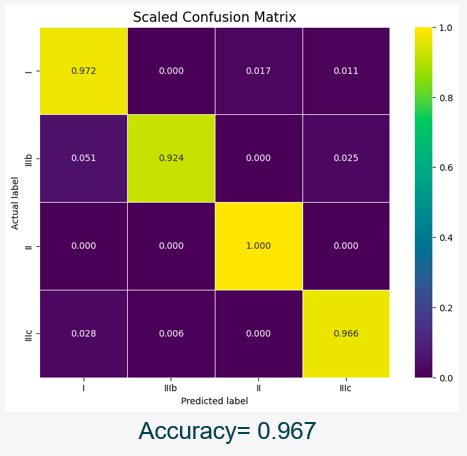
In general, this approach allowed us to improve the accuracy of the classification. For example, here is the confusion matrix for the classification of the QC subgroups, with an accuracy of almost 97%. Comparing to the first figure representing the accuracy of only the HMM profiles, we can see that in this case, the random forest approach improved the accuracy by almost 5%.
Classification pipeline
Now that all of our HMM profiles and random forest models were built, we could design a classification pipeline that would take as input a fasta file containing one or multiple sequences and that would be able to classify them accurately between the different groups and subgroups. If you want to test it, it is disponible on the GitHub repository of the project.
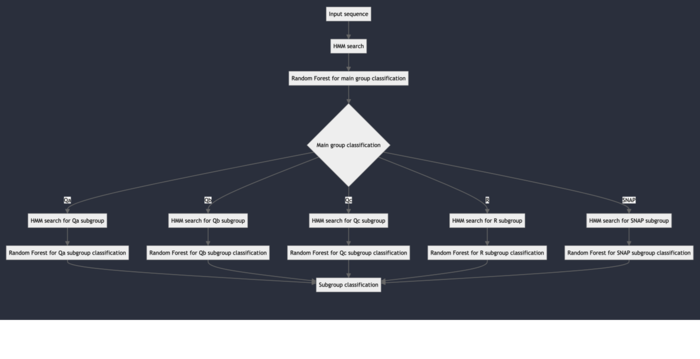
As you can see on this image, the pipeline will first score a sequence with the HMM profiles of the main groups, and the resulting scores and e-values will be used by a random forest model to determine to which main group the sequence belongs. Then, the sequence will be scored by the HMM profiles of the subgroups corresponding the group it was assigned to, and a random forest model will finally take the subgroups e-values and scores to classification the sequence in the correct subgroup.
Conclusion
In conclusion we already have a quite accurate classification algorithm, but we could still improve a few points that we could not cover due to time and computational power constraints.
First, we could try to base the main groups classification on the phylogeny. Then, instead of using average linkage, we could also build our trees with Iqtree which is a software that will use the best model to build a tree. Finally, it would be interesting to investigate more in detail why fungal proteins tend to cluster together in phylogeny.


