![]()
Human populations have colonized high altitude (HA) habitats (above 2500m of altitude) multiple times and independently. HA habitats are essentially characterized by lower biodiversity and low levels of oxygen availability, also called hypoxia. Classically, organisms respond to this decreased oxygen saturation (O2 sat) by increasing their hemoglobin (Hb) concentration. Nonetheless, such an acclimatization process is often associated with health issues and often results in altered reproductive success. Thus, long-term survival at HA may have brought about adaptations to counter these outcomes in human populations, such as the Andean, Tibetan or Ethiopian highlander populations. Several studies have intended to look for signatures of natural selection in these populations, asking several interesting questions about the nature and strength of selection at the phenotypic level, as well as its effect on the genome. Thus, it has been found that human populations don’t respond in the same way to similar selective pressures associated with HA : Andean highlanders show a large increase in Hb levels, while Tibetans and the Amhara (Ethiopian ethnic group that colonized HA habitat more than 5 ky ago) show little. Genomic studies conducted on Tibetan highlanders have found single nucleotide polymorphisms (SNPs) that are significantly associated with variation in Hb levels, bringing evidence for an adaptive response to hypoxia in these populations. An open question then remains to be asked : would those genetic changes be the same in highly divergent human populations, such as Ethiopian, that have been exposed to the same conditions but present different physiological characteristics ?
To answer this question, the authors have conducted a survey of the genetic architecture of adaptation to high altitude in two closely related Ethiopian ethnic groups that have colonized two HA habitats : Amhara and Oromo. Their purposes were multiple. Firstly, they attempted to identify signatures of selection in the genomes of both populations in order to compare these with results found in Tibetan highlanders. Secondly, as the Amhara have inhabited above 2500m for about 5 ky, while the Oromo have moved up to HA only around the early 1500s, the authors wanted to search for a gradient of adaptation levels to hypoxia in two groups that are genetically very close (the authors indeed report a mean Fst value at the genome-wide level of 0,0098 between them). Thirdly, the original point of the study is a comparison of epigenetic effects related to HA between high- and lowlanders of Oromo and Amhara, focusing on methylation levels.
Adaptive phenotypes
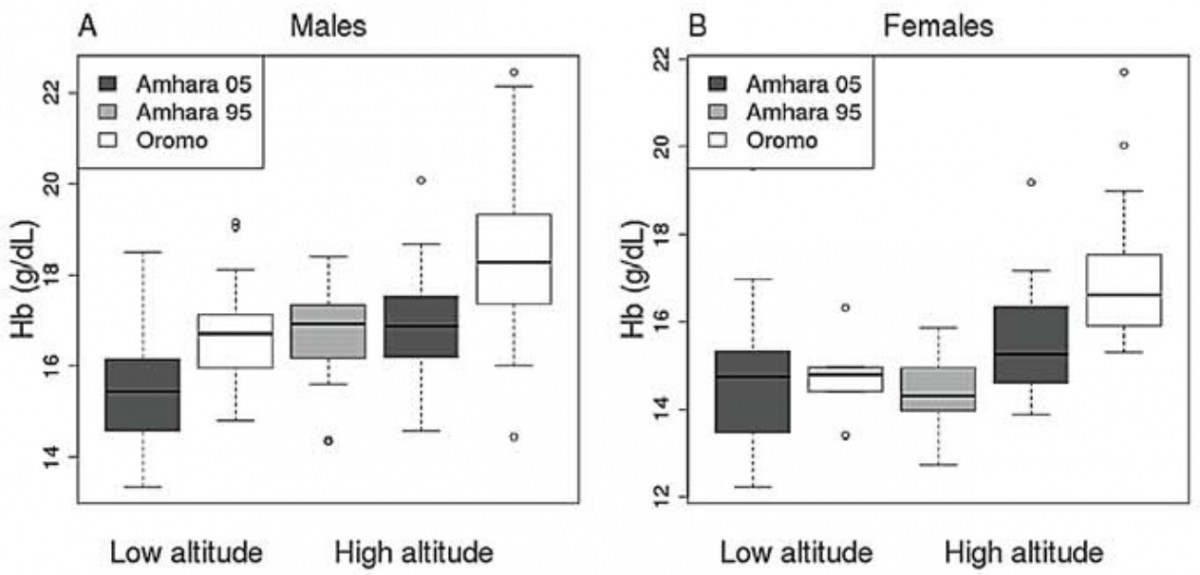
The authors used data from samples taken in 1995 and 2005 for Amhara and only in 2005 for Oromo. The Amhara showed significantly lower levels of Hb concentration than the Oromo, suggesting a difference in the adaptive phenotypes between the two groups, as expected (figure 1). It is to be noted that we observe a rather strong difference in Hb levels between males and females of both groups. The authors suggest that factors such as the menstrual cycle could affect these results. What is more surprising is the observed difference in Hb level between the Amhara samples from 1995 and 2005. It would be highly unlikely to observe such a difference due to differences in the altitudes at which sampling was done (in 1995, the Amhara were sampled at 3530m ; in 2005, the Amhara were sampled at 3700m). Such differences could come from a seasonal effect however, or from a change of the sampled individuals, comparing long-time residents to short time residents. Unfortunately, the authors don’t comment on this point, nor did they give insights that could help to understand this striking result.
Genome-wide association signals
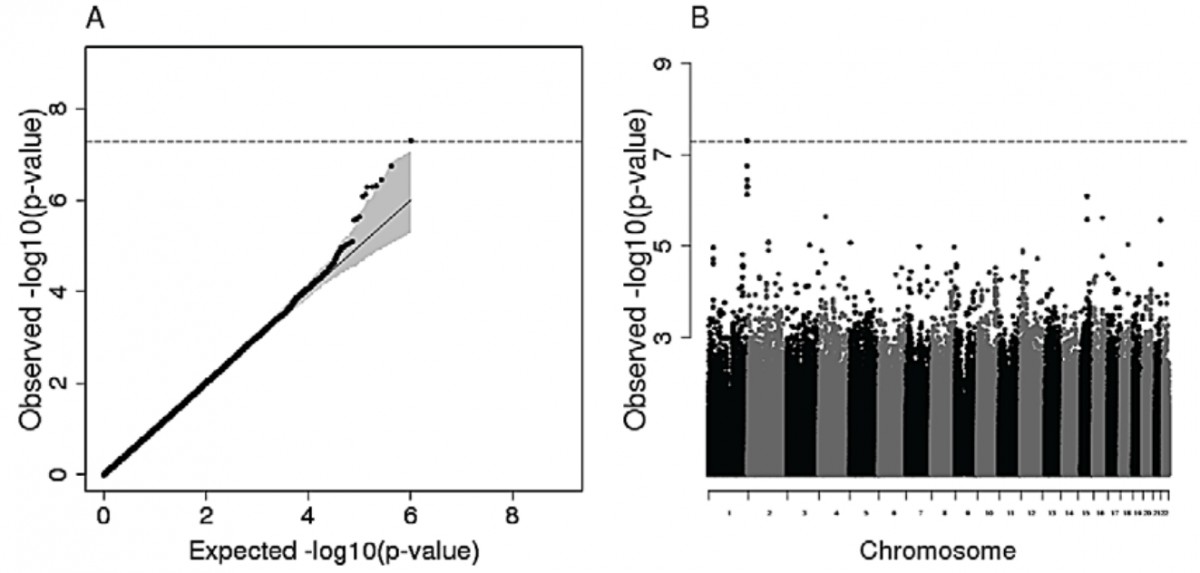
In order to assess for signatures of selection at the genomic level, the authors conducted a genome-wide association analysis (GWAS) to investigate whether some SNPs are significantly associated with the measured Hb levels and O2 sat, or if the observed genomic polymorphism is equivalent to what would be observed under neutral conditions, simulated here by permutations. No association signal has been detected with variation in O2 sat, which is not surprising given the poor heritability calculated for this trait in Andean and Tibetan populations. Interestingly, no signal was detected for the Oromo samples, whereas the Amhara showed a genetic contribution to variation in Hb levels despite the highly stringent Bonferroni correction that was applied. Indeed, a SNP on chromosome 1 shows a significant association level (Figure 2), with six other SNPs in strong linkage disequilibrium with the previous (Cf. The Manhattan plot on Figure 2). Nevertheless, this SNP is located in a genomic region (600 kb) within which no gene is found, and the closest ones do not play an obvious role in the variation in Hb levels. On the contrary, the second strongest association signal corresponds to a SNP located within the RORA gene, a gene associated to the “response to hypoxia” gene ontology (GO) term.
Despite the RORA association signal, it is to be noted that the sample size of the GWAS is rather low, and the results will need replication to be confirmed. Additionally, the authors have tested for an association between Hb levels in Amhara and Oromo and genomic regions within 10kb from SNPs that have been found associated with the adaptive response to hypoxia in Tibetans (EPAS1 and EGLN1 SNPs). This analysis has revealed a very interesting outcome, as no signal of association was detected. This permits us to draw the conclusion that the loNoneci that are associated with variation in Hb levels in Tibetans are not underlying the same phenotypes in the Ethiopian ethnic groups.
Differences between Ethiopian high- and lowlanders
The authors used two different approaches to assess for genomic regions implicated in divergence between high- and lowlanders of Amhara and Oromo, and that show signatures of selection : population branch statistics (PBS), and multiple regression (MR) for detecting high allele frequency differentiation. The results of both methods were congruent and revealed loci with a role in defense against pathogens, especially malaria and schistosomiasis. Indeed, the pathogen load and diversity is drastically different between low altitudes (LA) and HA, with an increase of both pathogens at low altitudes compared to high altitudes in the sampled populations. This seems to have led to strong divergent selection between high- and lowlanders, and explains much more of the variation in the divergence between them than adaptation to hypoxia.
Methylation differences between high and lowlanders
Surprisingly, methylation levels have been measured on different tissues for the Amhara and Oromo samples. Indeed, blood samples were used for Amhara and saliva samples for Oromo, with no indication on the respective sensitivity of these two tissues to methylation, which could generate a strong bias in data interpretation. The authors then chose to assess differences due to altitude within each ethnic group, preventing the drawing of any conclusions on the differences between them. While no CpG sites showed significant methylation differences, four sites showed significant divergence between LA and HA after correction. However, none of these were located next to any genes that are known to play a role in responses to hypoxia. As an outcome of this analysis, the authors proposed that this could indicate that methylation is involved in first steps of adaption, even though the results are not very conclusive on this point.
In conclusion, even if several stories can always be told with genome wide association analysis, the most important results that this study identify, and that one should note down is that the loci showing adaptation signatures to HA in Tibetans don’t show any association with adaptation to hypoxia phenotypes in Ethiopian ethnic groups that have settled at high altitude for a fairly long time or for about five hundred years. Instead, genomic regions related to pathogen defense explain much more of the differentiation between high- and lowlanders of Amhara and Oromo, as Malaria and Schistosomiasis are prevalent at low altitudes but not at high altitudes.
Alkorta-Aranburu, G., Beall, C., Witonsky, D., Gebremedhin, A., Pritchard, J., & Di Rienzo, A. (2012). The Genetic Architecture of Adaptations to High Altitude in Ethiopia PLoS Genetics, 8 (12) DOI: 10.1371/journal.pgen.1003110