
![]()
Genomic Variation in Seven Khoe-San Groups Reveals Adaptation and Complex African History.
The origin of modern Human is clear with evidences coming from many different disciplines. Africa is the continent where the highest genetic diversity is found; this clue associated to fossils records strongly supports the theory of a African origin with a migration out of Africa around 100’000 years ago (Templeton, 2002). Moreover other populations in the world confirm this pattern in showing a subset of this diversity. The history of the emergence of modern human is more debated, especially in two points, for the inside story of African divergence between groups and for the number of times the out of Africa occurred.
In this study the focus is made on the internal history of Africa. In order to respond to a lack of study about genome-wide in different ethnic groups of African, the authors focused on the deepest mitochondrial lineages known that are represented by the different click-speaking ethnic groups of southern Africa. A number of 220 individuals of 11 groups were genotyped for SNPs, resulting in ~2.3 million of markers. Populations were characterised by their languages subdivision as well as by their mode of subsistence (hunters-gatherers and farmers-pastoralists). This genetic information coupled with three other datasets (HGDP, HapMap and Henn et al. 2011) give important new incomes about the origin of modern human as well as on adaptation of certain important genes.

(A) Sampling locations. (B) PCA of African individuals showing PC1 and PC2 rotated to fit geography. (C) PCA for Khoe-San populations (?2.3 million SNPs). (D) Pairwise FST for sub-Saharan populations (excluding the Hadza; see fig. S24 for comparison). (E) Prediction of the genetic components from geographic, linguistic, and subsistence covariates. The predictive error relative to geography is given for each combination of covariates (values <1 show improved predictive capacity as compared to that of geography).
Composition and genetic Structure of Sub-Saharan populations
The principal component analysis discriminate two major groups that are also well represented with the pairwise Fst values (Fig. B and D). Northern populations compose the northern group with a majority of farmers while in the south we find a majority of non-bantu speaker and non-farmers. It seems also that the axes represent well a northwest geographical axis as well as an east-west axis. After exclusion of Bantu-speaker from the data, they obtain a much better correlation between geographical and the genetic sub-structure of southern populations (Fig. C). The geographical component is not the only other variable that could explain the genetic structure; language as well as subsistence could be added to the model, once mixed altogether the model shows a much higher predictive capacity thus demonstrating that these factor were probably essential to shape the genetic structure (Fig. E).
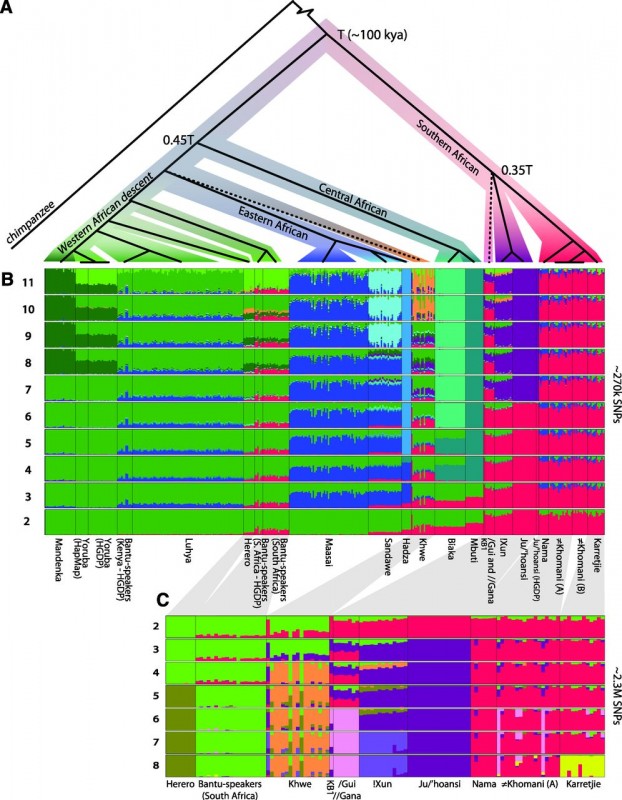
(A) Rooted population topology from a concordance-test approach (14). Nodes with bootstrap support 85%. (B) Clustering of 403 sub-Saharan African individuals (?270,000 SNPs), assuming 2 to 11 clusters. (C) Clustering of 118 southern African individuals (?2.3 million SNPs), assuming 2 to 8 clusters. Compare with fig. S16, which includes recently admixed individuals.
The clustering analysis (Fig. 2B and C) describes a similar pattern as the PCA with many major groups increasing with the number of K, a major split between the southern populations and other African populations is highlighted with a more detailed substructure in the Khoe-San group. The population topology was build using a concordance tests approach with an infinite mutation model (IAM) then a coalescent model was used to estimate the divergence time between the different populations. The Khoe-San show the deepest divergence among extant modern human to date, with a divergence time of ~100’000 years ago. This divergence might have occurred at the same period of the last wave of expansion out of Africa between 125’000 and 60’000. A recent study by Soares et al. defined the maximum of the out of Africa at ~70’000 year old based on the mtDNA haplogroup L3 suggesting that maybe the split with the southern populations occurred before the expension in the middle-east and in Europa. A first wave of migration to the south before the migration out of africa seems to have occured, the lactase persistence gene with a decrease in haplotype to the south tend to confirm this pattern. Moreover the Maasai that are from the eastern part of Africa and have the highest haplotype frequency of this lactase gene are supposed to be related to the group that left Africa.
Origin of modern human
Previous studies have shared opinions, based on greater level of genetic diversity and lower level of linkage disequilibrium (LD), between a sub-Saharan or a southern origin, although fossils record suggests an eastern origin. With different measure, haplotype heterozygosity, haplotype richness, runs of homozygosity (RoHs) and LD this study underline the classical view of a single origin from Africa but also highlighted a more complex history inside Africa with not a single origin region in the continent.
Selective Sweeps
A search of selected SNPs showing sign of selective sweeps across the 2.3millions SNPs was made with a method detecting selective sweeps that have not yet reached the fixation. The method call iHS (integrated haplotype statistic) found that many sign of selective sweeps where associated with certain part of the genome known to be related with distinct phenotypes. Peaks were found on chromosome 1, 4, 6 and 10 of different populations. These peaks have association with different muscle functions, like muscle growth and function for the myopalladin as well as for fast-twitching muscles and elite athletic performance.
They found also in two populations a more interesting peak in chromosome 6 close to the major histocompatibility complex (MHC) surrounded by several genes known to protect against infectious diseases. One other region is also of interest and linked to lifestyle factor and past subsistence, the lactase persistence gene that is more present in eastern populations like the Maasai with the highest haplotype frequency of 40% show a little decrease to the south with Nama population presenting 35% of the haplotype suggesting a migration from the east to south bringing pastoralisme, however in the west the haplotype disappear completely.
Differentiated and shared diversity
Genome wide Fst were plotted against single greatest Fst in order to detect region with higher differentiated SNP variants in pairs of populations (Fig. 4C). Chromosome 16 has one particular region with high Fst values exceeding 0.88 mainly for the comparison between Nama and Khoe-San. This region being well known as counting an active binding site of transcription enhancers that probably regulate gene linked to pigmentation and sensitivity to ultraviolet light. The Nama group shows a strong introgression from the Bantu-speaker in chromosome 16 (Fig. 4D) probably recent and resulting from the bantu expension.
A number of selected genes were highlighted to be important in modern human evolutionary history, base on aPBS approach, which use estimate pairwise Fst values transformed to the coalescent time scale, five gene were underlined that cover two major categories of human development the skeletal development and the neuronal function (Fig. 4F).

(A) iHS values for each SNP on chromosome 10 in Ju/’hoansi, surrounding the muscle gene MYPN, and (B) on chromosome 6 in ?Khomani, surrounding the immune system genes PRSS16 and POM121L2. The empirical P values (14) for 200-kb regions centered on the peak are given for each population. Locations of genes are shown by blue rectangles. (C) The greatest FST values for particular SNPs and pairwise population comparisons versus genome-wide FST estimates for the same population comparison. The top pairwise comparisons involving the Nama and another Khoe-San population (yellow) are found in the same region, separated by less than 4000 bp. (D) Proportion of genome-local ancestry (14, 24) for chromosome 16 in the Nama assigned to Khoe-San, Herero, or Bantu-speakers (South Africa). The population-specific chromosome-wide means are shown as dashed horizontal lines. The 99 percentile for Bantu-speakers (South Africa) ancestry, and the 1 percentile for the Khoe-San ancestry are shown as dotted horizontal lines. The two top SNP FST values are highlighted in yellow in (C) and (D). (E) Illustration of the aPBS approach for detecting selective sweeps in early modern humans. AMH, anatomically modern humans. (F) Stretches of consecutive positive aPBS values, with the top aPBS value plotted against the size of the stretch.
Conclusion
In conclusion the main newest points brought by this study are, first a new view of the inside Africa genetic structure that show a more complexes shape of the inside Africa genetic structure before and after the migration to the East with a window into the past of human evolutionary approximately 100’000 years ago brought by southern population of Khoe-San. Secondly this window offer to the author the possibility to study different selected gene that were important in shaping modern humans morphology, mainly for skeletal development and neuronal function.
Schlebusch, C., Skoglund, P., Sjodin, P., Gattepaille, L., Hernandez, D., Jay, F., Li, S., De Jongh, M., Singleton, A., Blum, M., Soodyall, H., & Jakobsson, M. (2012). Genomic Variation in Seven Khoe-San Groups Reveals Adaptation and Complex African History Science, 338 (6105), 374-379 DOI: 10.1126/science.1227721
Alan Templeton. (2002) Out of Africa again and again. Nature 416, 45-51| doi:10.1038/416045a;
Pedro Soares, Farida Alshamali, Joana B. Pereira, Verónica Fernandes, Nuno M. Silva, Carla Afonso, Marta D. Costa, Eliska Musilova, Vincent Macaulay, Martin B. Richards, Viktor Cerny, and Luísa Pereira. (2011) The expansion of mtDNA haplogroup L3 within and out of Africa. Mol Biol Evol, doi:10.1093/molbev/msr245