![]()
1. How genomes evolve in natural populations? is a question that, despite to be a long-standing search for geneticists, recent molecular genomic approaches may help to understand. Their evolution among natural populations may be shaped by forces derived from different processes, such as as mutation, neutral evolution, negative or positive selection and demographic changes (Nosil & Feder 2011). In addition, the study of population divergences and species formation has an important temporal context. That is, the point in time during the evolutionary trajectory of the set of populations or related species we aim to study, can display different patterns. For instance, during initial stages the level of genome differentiation may be low. Then, as divergence proceeds (by intrinsic or extrinsic forces) this level is expected to increase in the genome, in either a clustered or an interspersed way. Further, hybridization between differentiated populations may produce the secondary infiltration of genomic regions of one population into the other. The study of the genomic complexity in natural populations may shed light into the population dynamics and the relevant processes during species evolution.
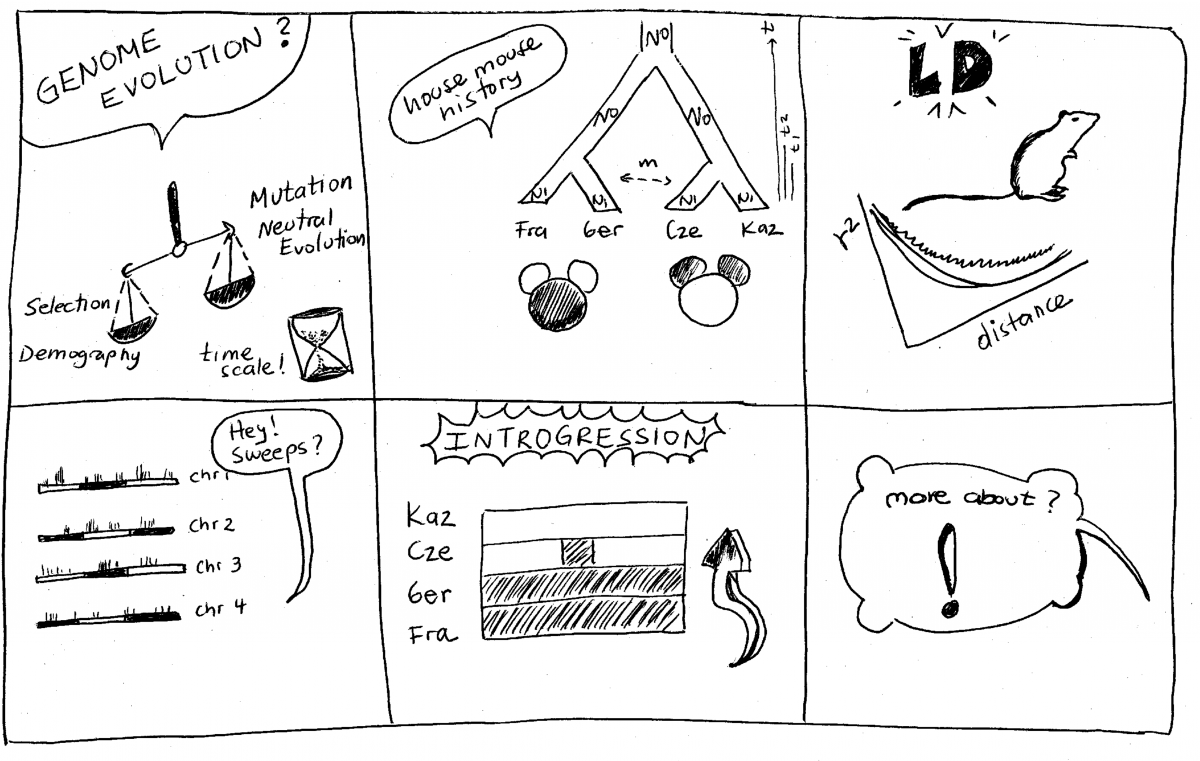
2. Staubach et al. (2012) used natural populations of house mice (Mus musculus) subspecies (M. m. domesticus which does not refer to a domesticated subspecies and M. m. musculus) to detect pattern of selection and introgression at a genomic scale. A large distribution across the world on varied habitats has characterized the past few thousand years of house mouse evolution. Two natural populations each subspecies were used. The proposed model of demographic history is depicted in figure 1 on the article [ ! ]. Mice were collected from 4 populations in Germany, France, Czech Republic and Kazakhstan, respectively. Eleven unrelated wild individuals per population were genotyped using Affymetrix Mouse Diversity Array for a total approx. 470,000 high quality SNPs. SNP calling was less reliable for M.m. musculus and lower polymorphic sites may reflect ascertainment bias towards M. m. domesticus [ + more about ascertainment bias see http://www.ncbi.nlm.nih.gov/books/NBK9792/]. Neighbor-joining trees based on the SNP set evidenced the population clustering of individuals (Ger,Fra),(Cze,Kaz). Some genomic regions, i.e. 6 MB in chr6, revealed an introgression pattern in M.m. musculus Kaz by M.m. domesticus haplotypes (Figure 1).
[ ! ] The demographic model assumes equal population sizes for the ancestral subspecies (N0) and for actual populations (N1), which could be not the case and events of bottleneck, range expansions, and effective population size (Ne) differences between populations might distort the discussed patterns.
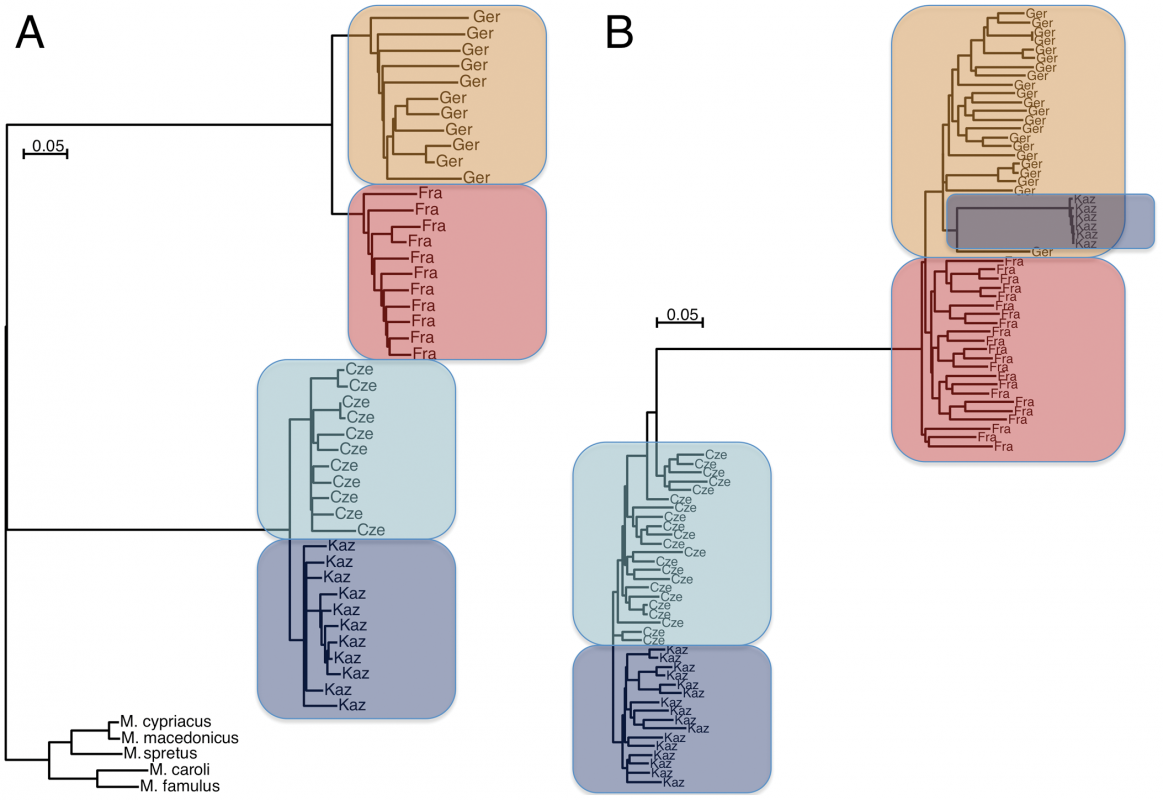
Figure 1. Neighbor joining trees of population samples, based on Manhattan distances. The scale bars refer to the number of substitutions per SNP genotyped. (A) For all autosomal SNPs in the study, grouped by sample and rooted by outgroup species. (B) For all haplotypes of a 6MB region on chromosome 6. Some haplotypes of Kaz group with M. m. domesticus due to introgression.
3. The estimates of linkage disequilibrium (LD) provided an indicator of the size of haplotypes physical linked, which when recognizing selected and diverged loci, may represent the expected size of genomic islands of differentiation. As we move away from the selected loci we expect a decay in LD [ + ]. Here, a linkage of SNPs beyond 100 kb is rare (Figure 2). Kaz and Cze populations showed the strongest and slower decay patterns, respectively. The first could be related with the high genetic diversity found in this population, and the latter pattern probably due to the introgressed regions. However, the removal of the introgressed regions does not eliminate completely the difference of Cze and the other populations [ ! ].
[ + ] LD plot presented here uses r2, defined as the correlation coefficient of the SNP frequencies. A value of 1 is called Perfect LD. r2 is affected by recombination rate and Ne.
[ ! ] The slow r2 decay in Cze after removal of introgression may indicate further effects of either small population sizes or the level of genetic diversity in this population, or both. This could have been discussed in the study by including details from previous reported microsatellite screens and considering additional demographic models.

Figure 2. Pairwise LD (r2) between markers over distance for each of the populations in the study.
4. Selective sweep scans were based on the XP-CLR statistic [ + ], Rsb, delta-DAF and Fst. Thresholds (through simulations and constraints) were defined to visualize the distribution of potential selective sweep signatures across autosomes. Detected peaks seem to be scattered across chromosomes, few of them clustered and particular to specific populations (i.e. chr 6 presented three clusters of peaks for Kaz population, Figure 3). Summary statistics showed striking differences in the number of significant regions when using one or other method. Several loci were identified under potentially recent positive selection with non-significant GO category enrichment.
[ + ] In basics, XP-CLR statistic or “cross-population composite likelihood ratio test” uses population differentiation as a means to detect regions under selection and hence is particularly robust against ascertainment bias. It works with biallelic multilocus data, searching for regions in the genome, where the change in allele frequency at the locus occurred too quickly (as assessed by the size of the affected region) to be due to random drift. Details of this method are presented in Chen et al. (2010).
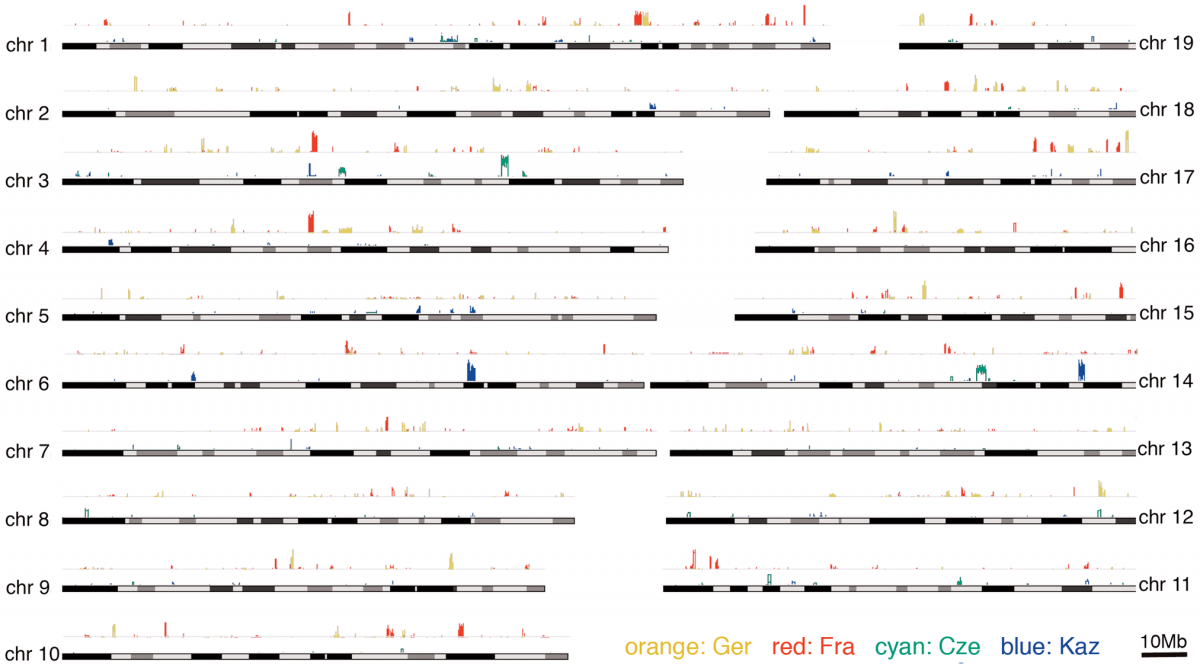
Figure 3. Distribution of selective sweep signatures as determined by the XP-CLR statistic for the two population comparisons across all autosomes.
5. Introgression was evaluated by comparison of focal vs two potential source populations. Each comparison includes the population of the same subspecies as one possible source, and the two populations from the other subspecies as alternative source. Large introgressed haplotypes were detected in Cze from M. m. domesticus, these regions were distributed across all chromosomes. Staubach et al. decided to compare the introgression patterns with a neutral migration-introgression model by simulating dataset with different population sizes and migration rates. The results suggested that the observed frequency of introgressed haplotypes would require higher migration rates than in a neutral model (4Nm=1). However, with these migration rates the expected fraction of introgressed genome should be higher than the observed for the Ger, Fra and Kaz populations. The authors suggested and emphasized that the large fraction of introgressed haplotypes is subject to forces that lead to a faster increase in frequency than expected by chance (i.e. a deterministic or selected process) [ ! ]. Incomplete lineage sorting was discarded by simulations without migration. Some of the introgressed regions were visualized as colored-blocks using UCSC browser.
[ ! ] Despite the the authors refrained from an even deeper exploration of the demographic parameter space, we discussed that the oversimplified demographic model used may neglect relevant differences in populations sizes or migration rate asymmetries. The mosaic nature of introgression has been reviewed in different systems by Arnold & Noland (2009). Here, the role of positive selection in shaping the genomes of house mouse populations, via introgressed haplotypes, is not completely understood.
Finally, the differentiation between house mouse subspecies evidenced a stage of genomic divergence similar to closely related species pairs (check the previously discussed Flycatcher’s genome paper). These two articles evidenced that genomic divergences between two sister species (completely separated lineages) and between subspecies (closely related populations) seems do not to involve few genomic regions or single loci, but differentiation across all chromosomes.
References
Arnold, M. & Noland, M. (2009). Adaptation by introgression. Journal of Biology 2009, 8:82 (http://jbiol.com/content/8/9/82)
Nosil, P. & Feder, J. (2012). Genomic divergence during speciation: causes and consequences. Phil. Trans. R. Soc. B. vol. 367 (1587), 332-342.
Chen, H., Patterson, N. Reich, D. (2010) Population differentiation as a test for selective sweeps. Genome Res. 20 (3): 393-402.
Staubach F, Lorenc A, Messer PW, Tang K, Petrov DA, & Tautz D (2012). Genome patterns of selection and introgression of haplotypes in natural populations of the house mouse (Mus musculus). PLoS genetics, 8 (8) PMID: 22956910