![]()
In this paper Richard E. Lenski and colleague are showing an example of how efficient adaptation by natural selection is. During 20 year they have been growing twelve populations of Escherichia coli in glucose medium containing also abundant citrate, this famous long-term evolution experiment called LTEE allowed the evolution to run for 40’000 generations in controlled laboratory conditions. Surprisingly after 31’000 generations some mutants appeared that were able to use citrate, as a source of carbon instead of glucose, the inability to use citrate is one of the frame that define E.coli as a species. Researcher Zachary D. Blount dissected all the mechanism in using whole genome re-sequencing of 29 clones along the population history (Fig.1). Three steps are analyzed in details, as they were necessary to permit the evolution of Cit+ trait, potentiation, actualization and refinement.
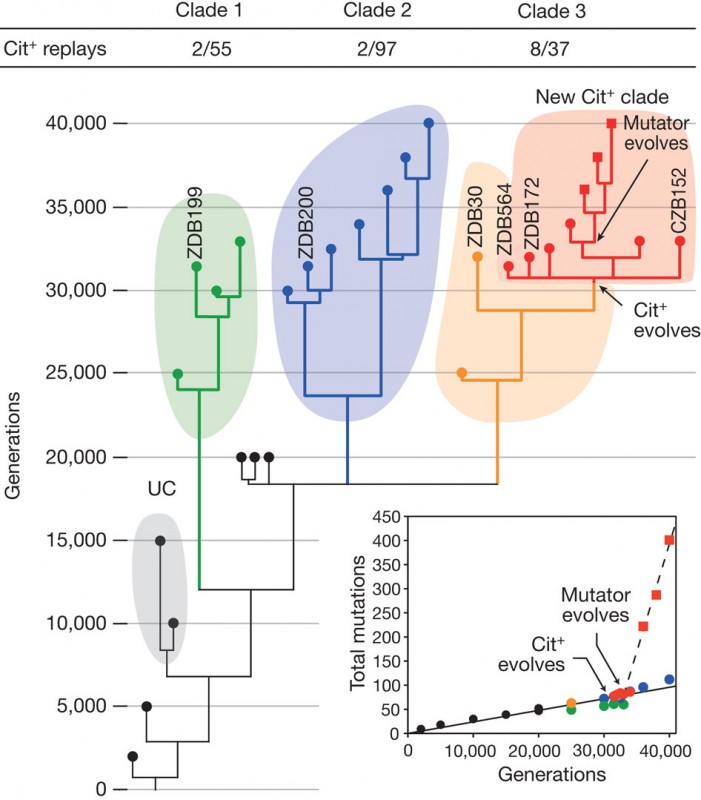
The phylogeny (Fig.1) highlight two clades that coevolved and were maintain with the new Cit+ clade around generation 20’000 (Fig 1.). Moreover after the evolution of the citrate clade around 36’000, bacteria that have Cit+ phenotype have a SNP that is causing a defect in methyl directed mismatch DNA repair such that mutants accumulate SNPs much faster than any other clades. (Fig.1 inset).
To analyze the three steps leading to the evolution of this new trait, bacteria are ideal organism as they can be frozen and revive, with this capacity replay experiments were run and a proportion of new Cit+ mutants were re-discovered in the three clades (Fig.1) with a significantly higher proportion for the third clade.
1) The first step of potentiation is represented by the clones of the three clades at generation 20’000 with different level of potentiation implying multiple potentiating mutation. It’s the genetic background that evolve and allow a function to be accessible by mutation. Phylogeny tells us that at least two mutations occur, one before that the three clades diverge and another one in Clade 3. The replay experiments showed that potentiation play an important role for the rise of the new function. This mechanism of potentiation can be explained in two different ways, first epistasis between the background and the mutation, this interaction will express the phenotype and second the background physically promoted the final mutation. In testing this they were not able to show evidence for one or the other hypothesis. Little clue tip the balance in favor of the epistasis hypothesis. But the arguments here are not enough convincing therefore the author focused on identifying the mutational basis of actualization.
2) Actualization is the step where weak mutants appear and is able phenotypically to use citrate; it’s also the most tractable step. The inability to transport citrate is the reason why E.coli cannot use it as a source of carbon in oxic environment. Thus in the Cit+ clones and only on these clones they found that they all have at least two tandem copies of a citrate fermentation operon (cit) that contain a citrate/succinate antiporter ,ciT (Fig. 2)
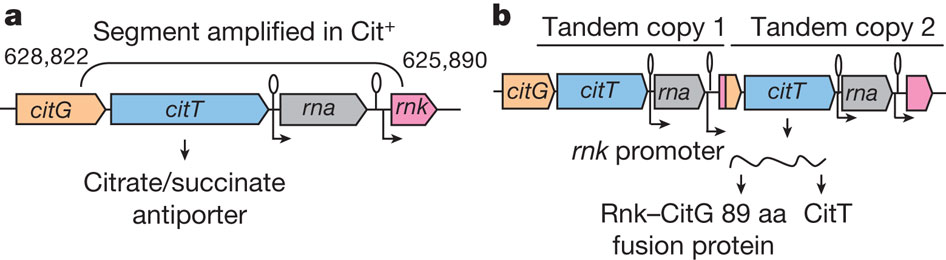
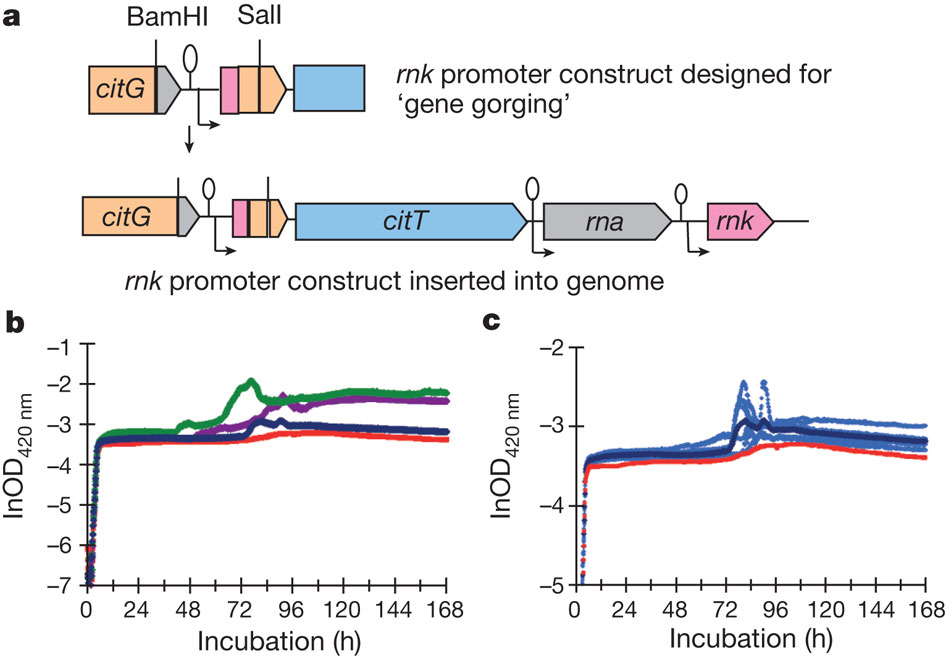
The explanation proposed by the author to the arising of this new trait is that the second citT of figure 2b is using a rnk promoter that is downstream the old citT but now due to the amplification it’s found upstream of the new citT, thus being able to be transcribe in a fusion protein Rnk-CitG-CitT.
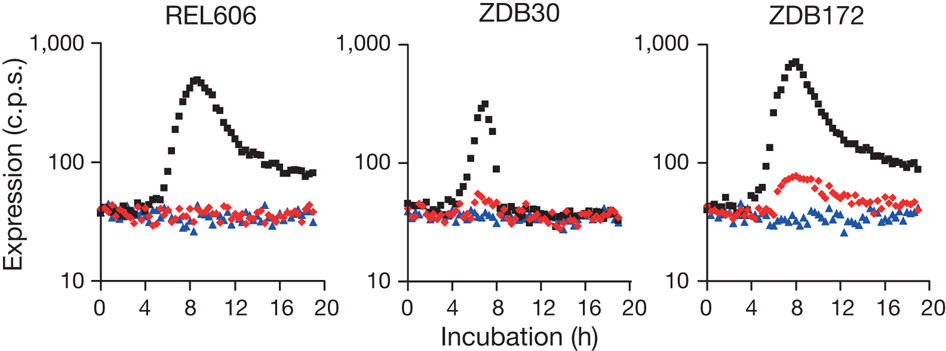
To test this hypothesis they first tested the ability of rnk-citT module to spport citT expression in oxic environment. They constructed three low copy plasmids with rnk, citT and rnk-citT. After transformation of each plasmid in three strains, one ancestral (REL606), one potentiated clone of clade 3 (ZDB30) and one weak mutant (ZDB172) they found out that they was expression (in red in Fig. 3) of the rnk-citT module in the two potentiated and weak mutant clones. These indicate that with the rnk-citT transformation there is citT expression under oxic conditions for potentiated clones.
This lead to another question; does the transformation of this module into clones give a Cit+ phenotype? To test this they simply inserted a rnk promoter upstream of the natural copy of citT found in the genome (Fig. 4). The construct (ZDB595 in blue) made with the potentiated clone ZDB30 and the insertion of rnk promoter show in figure 4 a weak Cit+ phenotype with an increase growth compared to the red curve (potentiated clone ZDB30) and other curve that are Cit+ phenotypes and have better growth on citrate.
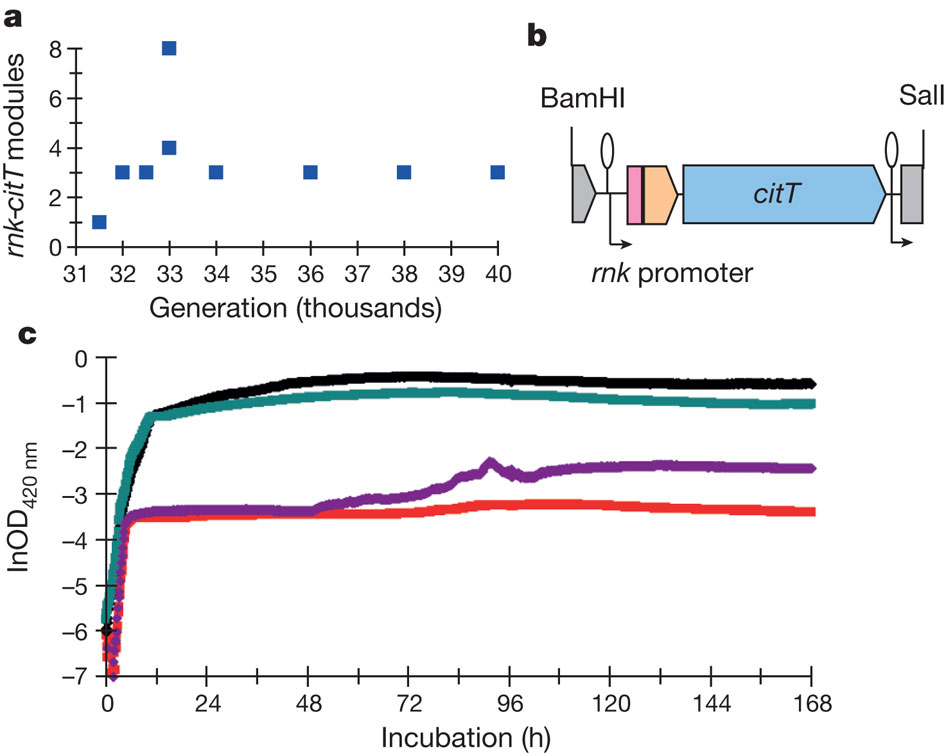
3) Finally refinement is the increase in efficiency of the new function by probably additional mutations. Here the main mutations that occur in the early Cit+ mutants are the increase in the number of copy of the cit operon (Fig.5a) with stabilization on later generations to three copies. To test if the number of copy influence the Cit+ phenotype, they cloned the module rnk promoter and citT into a multi-copy plasmid and transformed it into the potentiated strain ZDB30 (in red Fig. 5c). The new build strain ZDB612 (in green Fig.5c) is strongly Cit+ and is growing on citrate as a Cit+ clone (CZB152 in black), which is a good clue in favor of the refinement of Cit+ phenotype by the multiplication of the cit operon.
The neo-functionalization created by gene duplication was already observed in comparative studies, but this long-term experiment is a nice opportunity to study the history of the citrate transporter gene duplication and promoter capture that give rise to a new adaptive function. This example shows also the importance of the evolution of the potentiated genetic background that will allow a last mutation to give rise to the function.
Blount, Z., Barrick, J., Davidson, C., & Lenski, R. (2012). Genomic analysis of a key innovation in an experimental Escherichia coli population Nature, 489 (7417), 513-518 DOI: 10.1038/nature11514