The recent formation and habitat diversity of the Galápagos archipelago, in conjunction with its relative isolation from the mainland, has helped the islands become rich in endemic species that have much to offer for the study of evolutionary biology.
As a result of their volcanic origin and fluctuating climates, the islands of the Galápagos archipelago vary in age, size, topography and vegetation. In conjunction with their isolation from the mainland, this diversity of relatively new environments, both within and between islands, are perfect breeding grounds for speciation. The finches of the Galápagos archipelago and Cocos Island are the product of a fascinating adaptive radiation that started only about 1.5 million years ago, following the arrival of a common ancestor from South America. These finches are most notable for their diversity in beak morphology, which reflect the differences in their respective adaptations to exploiting various food resources. Charles Darwin’s observations of this diversity in beak morphology played an important role in the development of his theory of natural selection.
“Seeing this gradation and diversity of structure in one small, intimately related group of birds, one might really fancy that from an original paucity of birds in this archipelago, one species had been taken and modified for different ends” – Charles Darwin
There has since been great interest in the study of Darwin’s finches, and much research has been done towards the efforts of resolving their phylogenetic history and elucidating the mechanisms that drive their variation. In the paper reviewed here, the authors took the extraordinary step of sequencing the whole genomes of 120 individuals, representing all 15 of the Darwin’s finch species across the Galápagos and Cocos Islands as well as two close relatives (Tiaris bicolor and Loxigilla noctis) from Barbados. Analyzing this rich data set, they find important deviations from previous taxonomies and identify several genomic regions associated with beak shape.
Phylogeny
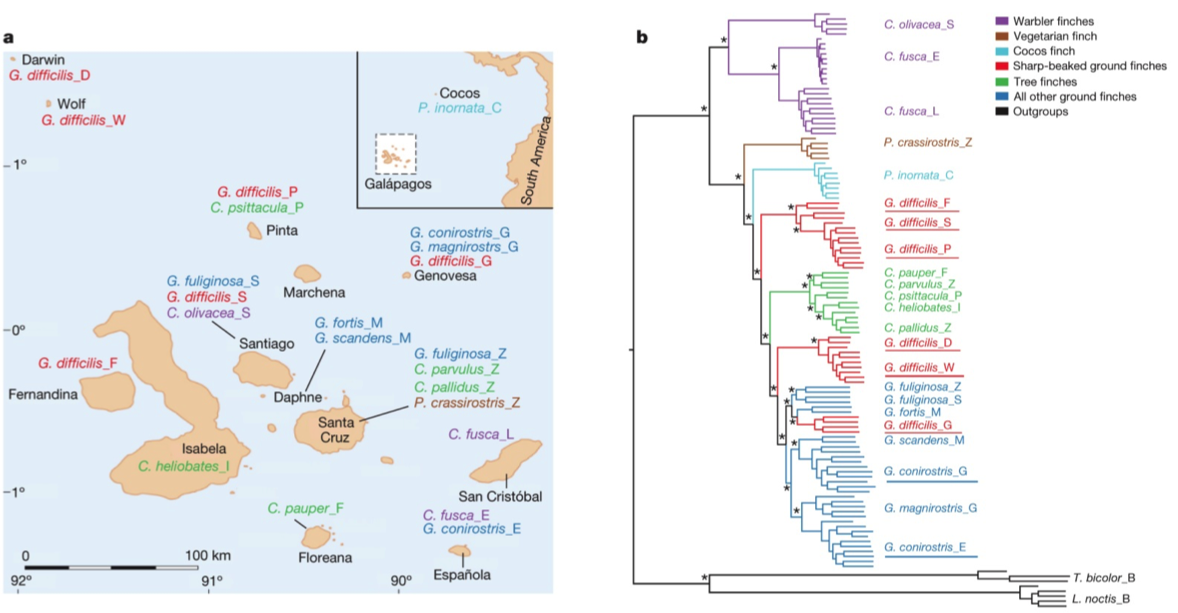
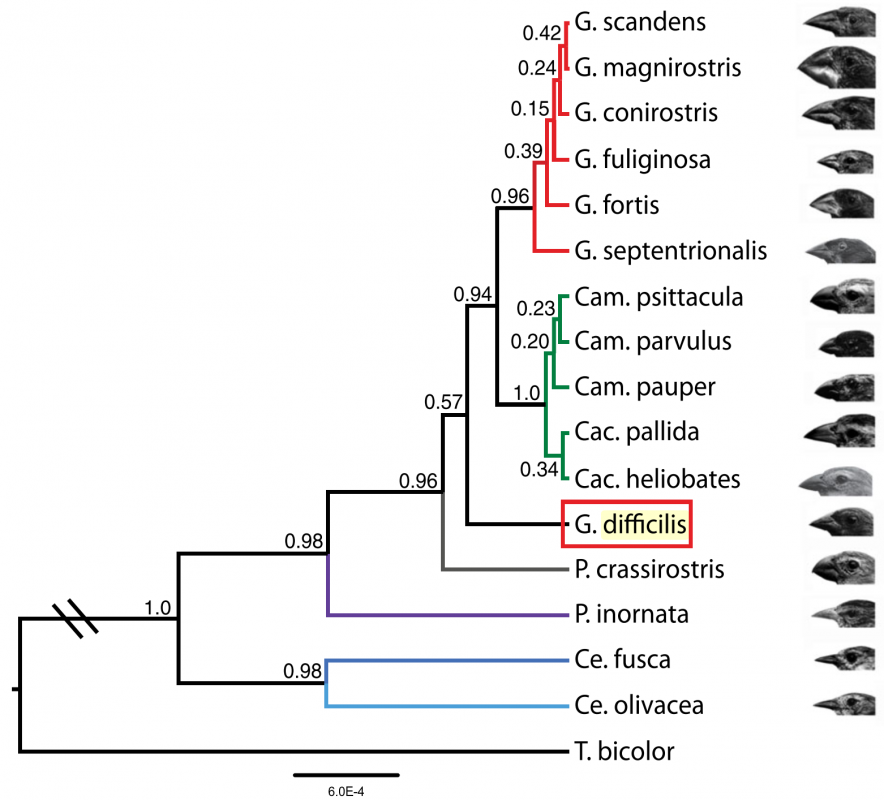
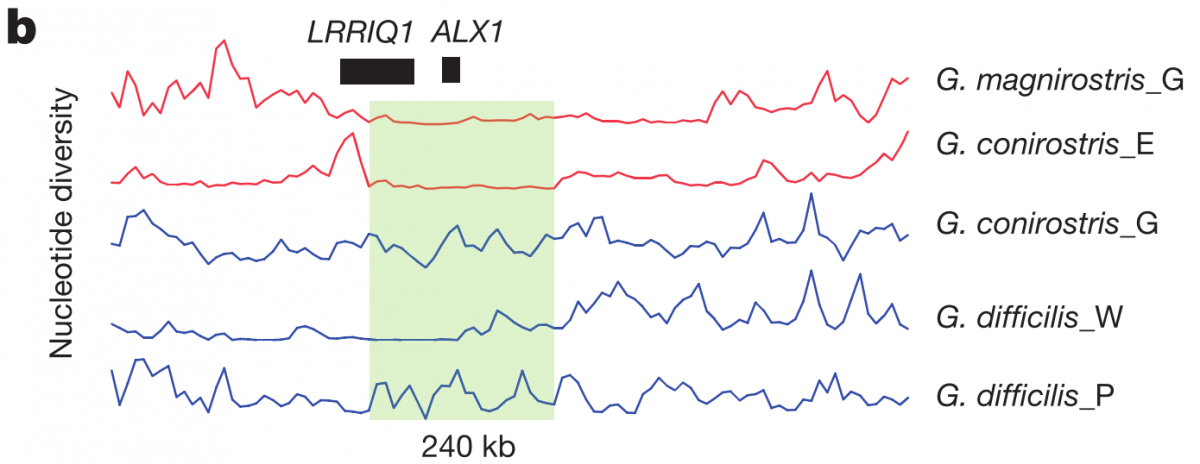
After sequencing and assembly, they generated four phylogenies according to (i) autosomal DNA (see Figure 1 above), (ii) mitochondrial DNA and (iii, iv) sequences linked to sex chromosomes Z and W. Their phylogenies largely supported previous taxonomies (compare Figure 1 with the tree to the right, which was generated using 14 nuclear introns and two short sequences of mitochondrial DNA (Farrington et al., 2014). However, this new genome-based phylogeny also showed some important differences. For one, as we can see in figure 1 above, the species classified as G. difficilis actually forms three distinct groups, which cluster geographically by the islands of (1) Pinta, Santiago and Fernandina, (2) Wolf and Darwin and (3) Genovese. Apparently this is consistent with taxonomies proposed in two studies that appeared in 1931 and 1945, but it is unclear to me why they remained classified as a single species until now.
Similarly, they found that G. conirostris is likely also paraphyletic, given that G. conirostris on Española was most similar to G. magnirostris, and G. conirostris on Genovesa was most similar to G. scandens. Following these findings, the authors of this study recommend that the taxonomy for G. difficilis and G. conirostris be revised to reflect their paraphyly, according to the new genome-based phylogeny.
Gene flow
Evidence for introgression was found by comparing the autosomal phylogenetic tree with those of the sex-linked loci and mtDNA, and through ABBA-BABA tests. They found that there has been extensive gene flow and hybridization between the species throughout the radiation, which likely contributed to their rapid evolution.
While this is certainly a very interesting find, it is perhaps unsurprising, given the proximity of the islands and the relative ease for individuals to fly from one to the other. This does offer a nice comparison to the adaptive radiations of cichlid fishes, which occur in geographically isolated lakes without the opportunity for gene flow between them (see blog post).
Genetic basis of beak shape
Now that they had this large genomic dataset, they wanted to address the question of how molecular differentiation contributes to beak morphology. They did this by choosing four closely related populations that differed in beak shape (two blunt and two pointed), and then scanned the whole genomes to identify regions with high genetic differentiation (Z-transformed FST, ZFST) between the two phenotypes. In figure 3a below, we can see that they have marked 15 regions with the highest ZFST values, along with the genes identified within them.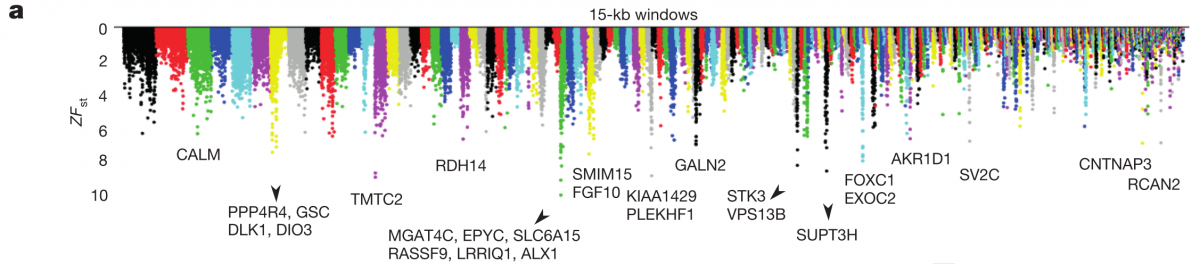
Of those genes, they found 6 that were previously reported to be involved with craniofacial/beak development in mammals and birds. Interestingly, they did not find high genetic differentiation in bone morphogenetic protein 4 (BMP4), a gene that was previously reported to show differential expression between beak types. This may be due to differential expression, and it’s a pity this study does not include any RNA-seq work to complement their huge genomic dataset, but perhaps they’re saving that for another Nature.
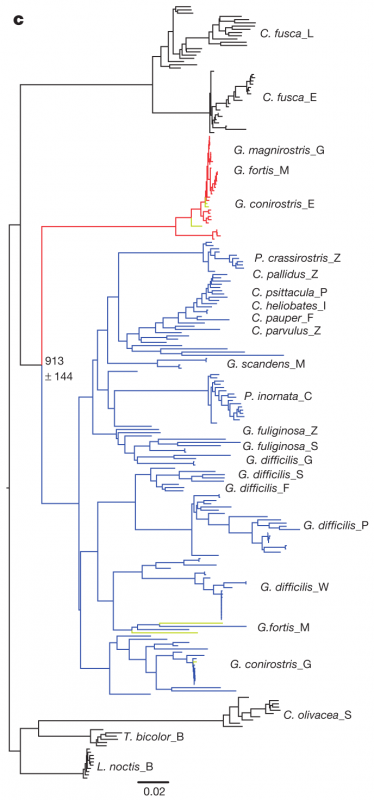
The highest ZFST peak contained the gene ALX1, which is involved in craniofacial development, and whose loss in humans can even cause severe facial clefting. The authors found that two variants of this ALX1 gene are present, and each remarkably corresponds to one of two categories of beak shape: blunt and pointed. A phylogenetic tree constructed from this region (figure 3c left) shows that the blunt shape was an early adaptation that seems to have been quite favorable; the short branch lengths among the blunt haplotypes (red) are indicative of a selective sweep, which is further supported by the low nucleotide diversity shown in figure 3b below (although it looks as though G. difficilis from Wolf may also be showing low nucleotide diversity in part of this region, possibly from introgression with G. magnirostris?).
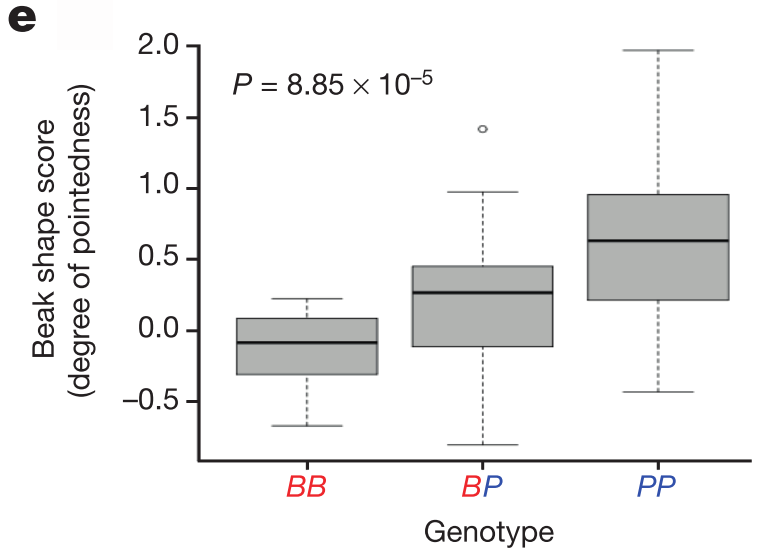
G. fortis populations show substantial diversity in beak shape, and so the authors then genotyped an additional 62 birds from this species and found a textbook association between beak shape and genotype (figure 3e below; BB is blunt haplotype homozygote, PP is pointed haplotype homozygote, and BP is heterozygote). While beak morphology certainly involves multiple genes, as evidenced by the 15 significant genomic regions, their work shows that ALX1 alone is one of the most important, if not the most important contributor.
Conclusions
The authors put in a tremendous effort to sequence the genomes of all of these individuals, representing each of the 15 Darwin’s finches, and once these are made accessible to the public they will no doubt be a valuable resource for any future studies involving those species, and indeed for anyone interested in the field of adaptive radiation. However, given such a large dataset, it would have been nice to see some additional work done, e.g. an assessment for possible differential gene expression of the genes within the 15 observed ZFST peaks, or further analyses of some of the other genes found in the ZFST peaks. I wonder also whether they might be able to apply an approach used in Zhan et al. (2014), which was used to identify regions of the genome associated withmigratory behavior in Monarch butterflies. This, or a similar approach, might yield more information than only scanning for high FST.
Update 21/10/2015: a previous version of this post stated incorrectly that the species tree from Farrington et al. (2014) was based largely on mitochondrial DNA.
Lamichhaney, Sangeet, Jonas Berglund, Markus Sällman Almén, Khurram Maqbool, Manfred Grabherr, Alvaro Martinez-Barrio, Marta Promerová, et al. “Evolution of Darwin’s Finches and Their Beaks Revealed by Genome Sequencing.” Nature 518 (2015): 371–375. http://www.nature.com/doifinder/10.1038/nature14181.