Blogpost on:
Malaspinas et al 2016 A genomic history of Aboriginal Australia. Nature 538: 207–214.
Introduction:
Prior to the publication of Malaspinas et al. 2016, investigation of Aboriginal Australian genome sequences had been quite limited. In fact, only 3 whole genome sequences from Aboriginals had been analyzed, 2 of these obtained with limited information concerning their place of origin (Rasmussen et al. 2011).
Malaspinas et al. 2016 is the first comprehensive study aimed at uncovering how the settlement of Australia occurred. The study combines genomic, linguistic and archeological studies in order to obtain more detailed information on how the settlement of Australia occurred.
For the largest part of the past 100000 years, Tasmania, New Guinea and Australia were part of the same continent known as Sahul. This continent was detached from mainland Asia, and its settlement process by human populations still remains poorly understood.
Previous archaeological evidence has led to the hypothesis that the settlement of Australia occurred from an African emigration wave, which predates the African emigration wave that settled in Eurasia (Lahr, M. et al. 1994). This has been coined the 2 Out of Africa event hypothesis (2OoA). Yet, other genetic studies support the notion that one major migration out of Africa (OoA) followed by 1 or 2 independent migratory waves led to the settlement of the modern Eurasian and Oceanic continents respectively.
The authors find that the data collected in the study more closely fits a model of single out of Africa dispersal (OoA), followed by divergence of Eurasians from Australo-Papuans. Finally the divergence of Aboriginals and Papuans from their common ancestral population ensued between 25000 and 40000 years ago.
Dataset
The study is based on 108 newly-sequenced Aboriginal and Papuan genomes (83 Aboriginals and 25 Papuans) and genotype data for 45 additional Papuans. Moreover, SNP genotype data on Aboriginal Australians from Arnhem Land and from the European Collection of Cell Cultures Panel defined in previous studies was taken advantage of for admixture studies.
Colonization of Sahul
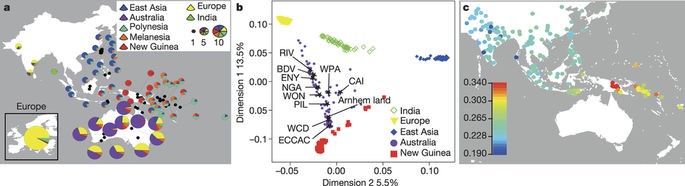
The authors use sparse non-negative matrix factorization (sNMF) on the combined datasets in order to determine the genomic ancestry proportions of Papuans and Aboriginals (Frichot, E. et al. 2014). The authors find that Aboriginals are mainly a mix of European, East Asian, New Guinean and Aboriginal ancestry. The most significantly contributing ancestry proportions stemming from Europeans and from Aboriginal ancestry. As expected, individuals from the Australian coastline displayed higher proportion of European ancestry compared to individuals from the desertic Australian inland.
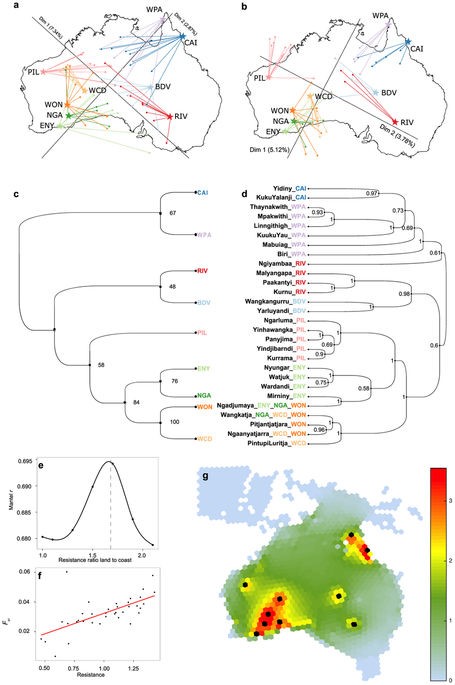
Papuans instead display a majority of genomic ancestry stemming from New Guineans and East Asians. The proportion of New/Guinean ancestry in Aboriginal Australians is related to the distance from Papua, with Northeastern Australians containing a significantly higher proportion of Papuan ancestry compared to Southwestern Australians (Fig. 2a).
Based on f3 statistics, multidimensional scaling analyses (MDS) and genomic ancestry proportion inference, the authors show that Australians and New-Guineans are more similar to each other than to the other populations analyzed in the study (Fig. 2b,c) This favors the hypothesis that they share a common ancestral population which settled the continent of Sahul.
For the subsequent analyses the authors mask data stemming from non-Aboriginal ancestry or select samples based on their Aboriginal Ancestry. Specifically, the authors filter the information from the ancestry proportions and maintain only loci in which both loci show Aboriginal ancestry (Suppl Inf S06).
In order to shed some light on whether the settlement of Australia proceed through one or 2 separate founding waves, the authors use a simulation-based framework initially presented in (Excoffier et al. 2013). Specifically, this composite likelihood method compares the observed joint site frequency spectrum (SFS) to the expected one, allowing inference of coalescence based on SNPs (Excoffier et al. 2013).
The SFS approximation and the MDS analysis results both suggests that, a one wave founding model followed by divergence of a common ancestor into Papuan and Aboriginal populations fits the data more closely (Fig. 2a,b, Fig.3).
Fig.1 (Malaspinas et al. 2016) Describes locations for analyzed Australo-Papuans datasets
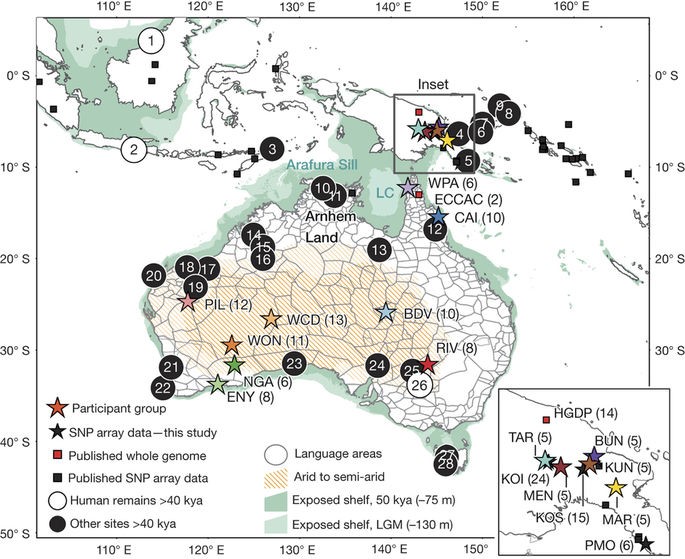
Fig.2 (Malaspinas et al. 2016) Australian Aboriginal Ancestry. A)Analysis of admixture in Australo-Papuans by sNMF. B-C) MDS analysis and f3-statistics to assess relationships within the Aboriginal population and between Australo-Papuans
Archaic Admixture
Next, the authors focus on characterizing the extent of archaic (Neanderthal and Denisovan) admixture contributing to the Australian and Papuan genomes. They do so based on the previously described SFS modeling-based approach, a D-statistics based on goodness-of-fit analysis (Green et al. 2010) and a putative archaic haplotype derivation method (Suppl Inf. Section 10).
D-statistics test was initially used in genetics (Green et al. 2010) in order to determine the extent of admixture between 3 populations. It compares which pair in a trio of tested populations is more closely related based on SNPs. The archaic haplotype derivation method used instead, is based on enhanced D-statistics (Meyer, M. et al. 2012) and linkage disequilibrium approaches (Wall, JD. et al. 2013)
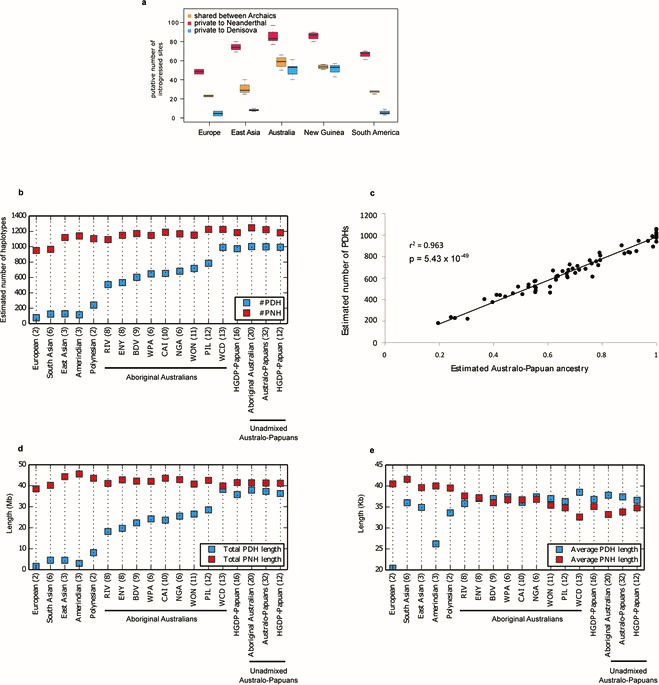
Based on the 3 approaches the authors report that Aboriginal and Papuan genomes display an accumulation of Denisovan introgressed genes compared to non-Africans, and have the highest proportion of putatively Denisovan derived haplotypes compared to non-Africans. Additionally, they show that the estimated number of Denisovan derived haplotypes correlates with the proportion of Australo-Papuan ancestry across individuals (Ext. Fig. 3a,b,c). In summary the evidence indicates that Denisovan admixture predates the split of Australo-Papuans and the widespread Eurasian admixture into Aboriginal Australians.
Ext. Fig 3 (Malaspinas et al. 2016) Archaic (Denisovan and Neanderthal) genome introgressed haplotypes. A) Analysis of putative introgressed Denisovan and Neanderthal sites in European, East Asian, Australo-Papuan and South American Populations. B-C) Analysis of estimated archaic haplotype number in world populations. D-E) metrics of archaic derived haplotypes in populations of study.
Out of Africa
In order to determine whether the OoA or 2OoA wave scenario is more likely, the authors peform D-statistic on the following trios: Aboriginals and Eurasians compared to Africans VS Aboriginals and Eurasians compared to Ust’-Ishim (proxy for modern human from Asian (Fu, Q. et al. 2014)).
The authors find that if not accounting for Denisovan admixture, Africans and Ust’-Ishim are closer to Eurasians than to Aboriginal Australians, supporting a 2OoA model. Yet when accounting for the previously identified Denisovan admixture events, the test results indicate that Aboriginals and Eurasians are equally related to Ust’-Ishim favouring a OoA wave model. The same is seen when taking into account Denisovan admixture and considering populations across the whole world (Ext. Data Fig. 4a,b).
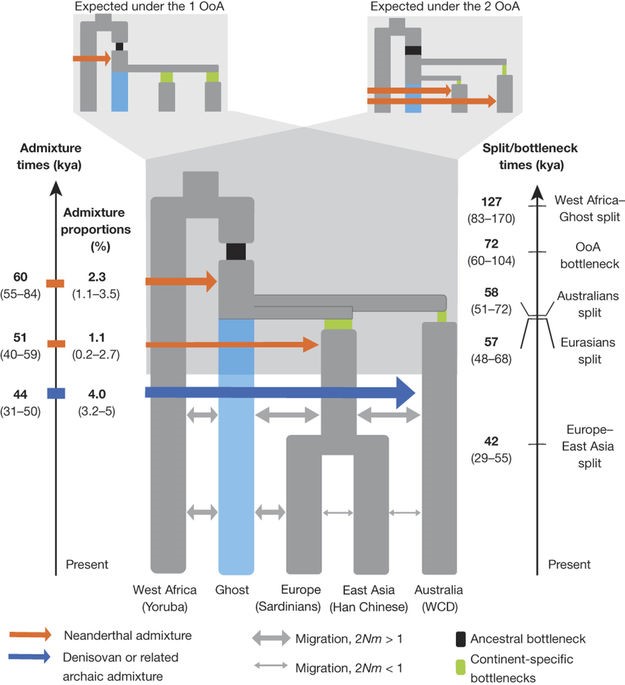
Implementation of the SFS-analysis and accounting for moderate Denisovan admixture also shows a more accurate fit of the data to the OoA model. The most accurately fitting model of the SFS-analysis shows that, first, Australo-Papuan divergence from Eurasians most likely occurred about 58000 years ago, and European divergence from East Asians occurred about 42000 years ago (Fig. 4).
Multiple Sequential Markovian Coalescence analysis also supports a model in which Australo-Papuans and Eurasians split from one ancestral population (Ext. Fig. 4, Ext. Fig. 6).
Fig. 3 (Malaspinas et al. 2016) SFS based modelling approximation of Australia settlement founding waves
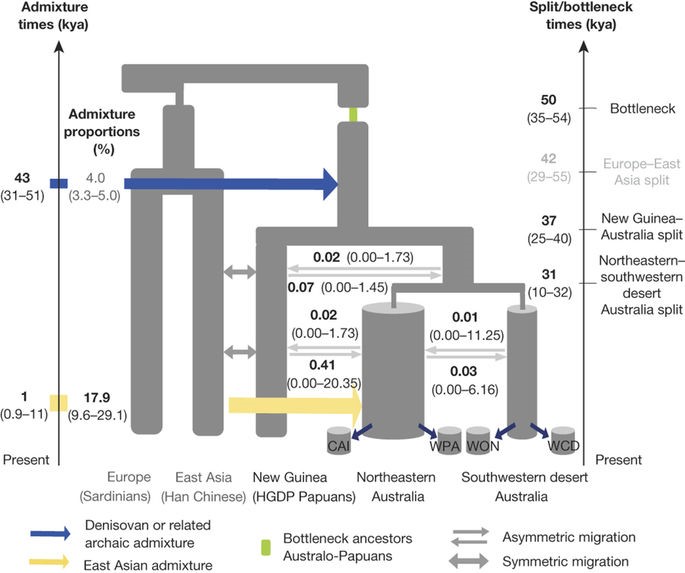
Fig. 4 (Malaspinas et al. 2016) SFS based modelling approximation of most likely OoA migration
Genetic Structure of Aboriginal Australians
Subsequent investigation of mitochondrial DNA (mtDNA) and Y chromosome between-group variation shows that male-mediated migration was a driving factor in the substructuring of Aboriginals. MDS analyses performed on Aboriginals masked and non-masked for non-Aboriginal ancestry and geographic location of samples (Ext. Fig. 7a,b)suggests a population separation between Southwestern and Northeastern groups. This is in line with the model proposed by the SFS analysis of Australian continent settlement.
Usage of an ulterior modelling approach based on a three layer neural network (Bishop, CM. 1996,; Heaton, J. 2011), reveals that a majority of the gene flow took place along the Australian coasts (Ext. Fig. 7e-g). This result is consistent with the hypothesis that desertic internal Australian regions formed a natural barrier to gene flow.
Implementation of Bayesian statistics approaches for European, East Asian and Papuan admixture among Aboriginals reveals that Papuan admixture predated both East Asian and European admixture (Ext. Fig. 8a). Additionally, local ancestry inference based on tract length also underlines that Papuan gene flow into Aboriginals occurred before European and East Asian gene influx.
Ext. Fig. 4 A)D-statistics based proposed model for African emigration models. B) Sum of squared errors for the possible odels predicted by D-statistics. C)MSMC derived crosscoalescence rates determined by analysis of pairs of individuals. D) Assessment of archaic admixture on cross coalescence presented in C by modelling

Pama-Nyungan languages and genetic structure
Next, the study investigates how closely linguistic demographics could reflect genetic relationships by comparing phylogenetic trees obtained based on linguistics and trees based on Fixation index masking for Eurasian tracts (Ext. Fig. 7). Analysis of the common patterns identified in the two trees by distance-matrices and correlation analysis of linguistics and genetics reveal an initial divergence of populations beginning about 30000 years ago, followed by population size changes and highly reduced gene flow from Northeastern to Southwestern Australia, due in great part to the desertic geographic barrier.
Ext. fig. 7 A-B) MDS analysis performed when including all genome sequences (A) and when masking non-boriginal variants. C-D) Comparison of phylogenetic trees computed based on genetic and linguistic analysis respectively.
Selection in Aboriginal Australians
Finally, the authors perform scanning analyses to identify Aboriginal genomic regions which diverge highly in allele frequency since the split from Papuans (about 10000-30000 years ago), followed by identification of genomic regions which diverge highly based on geo-ecological location. Based on this analysis the authors identify two mutations which may have played a role in Aboriginal adaptation to the arid and desert Australian interior.
Conclusions
The authors analyses supports a model by which a OoA movement, followed by the split of an ancestral population which first colonized Australia and predated the physical separation of Sahul into Mainland Australia from the Papuan/New Guinea islands.
References:
Rasmussen, M. et al. An Aboriginal Australian genome reveals separate human dispersals into Asia. Science 334, 94–98 (2011)
Davidson, I. The colonization of Australia and its adjacent islands and the evolution of modern cognition. Curr. Anthropol. 51, S177–S189 (2010)
Lahr, M. M. & Foley, R. Multiple dispersals and modern human origins. Evol. Anthropol. Issues News Rev . 3, 48–60 (1994)
Frichot, E., Mathieu, F., Trouillon, T., Bouchard, G. & François, O. Fast and efficient estimation of individual ancestry coefficients. Genetics 196, 973–983 (2014)
Excoffier, L. Dupanloup, I. Huerta-Sanchez, E. Sousa, VC. Foll ,M. et al. Robust Demographic Inference from Genomic and SNP data. Plos Genetics 10, 1-17(2013)
Green RE, Krause J, Briggs AW, et al. A draft sequence of the Neandertal genome. Science. (56 co-authors). 2010;328(5979):710–722.
Meyer M, et al. A high-coverage genome sequence from an archaic denisovan individual. Science. 2012;338:222–226. doi: 10.1126/science.1224344
Wall JD, et al. Higher levels of Neanderthal ancestry in East Asians than in Europeans. Genetics. 2013;194:199–209
Fu Q, Li H, Moorjani P, Jay F, Slepchenko SM, Bondarev AA, Johnson PL, Aximu-Petri A, Prüfer K, de Filippo C, et al. 2014. Genome sequence of a 45,000-year-old modern human from western Siberia. Nature 514: 445–449
Bishop, CM 1996. Neural Networks For Pattern Recognition. 1 edition. Oxford New York: Clarendon Press
Heaton, J. 2011: Programming neural networks with Encog3 in Java. 2 edition. Heaton Research, Inc.