![]()
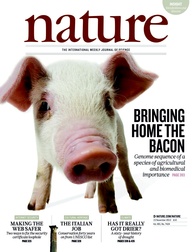
Pig domestication has started over 10 000 years ago and has had important consequences on human life, changing our agricultural and medical practices. Much has been argued on whether pig was domesticated independently across multiple locations or it was adopted by humans only once and then transported elsewhere. Originally, pig (Sus scrofa) has emerged in the South East Asia during the early Pliocene (~5.3–3.5 Myr ago) and then spread across most of the Eurasian continent. Yet, unraveling the true story of the pig domestication has become possible only recently, with a publication of a near complete pig genome by Groenen et al. featuring the Nature front cover in the November issue 7424, 2012.
Genome assembly
The research team (RT hereafter) made impressive efforts on genome sequencing and assembly. The genome was sequenced with both BAC and NGS technologies. For NGS the RT used 44bp paired-end Illumina library, which was likely the headliner technology from Illumina at the time of the initiation of the porcine genome project. In total, the RT obtained 2.60 Gb of sequencing data and thanks to BAC could assign scaffolds (2.5 Gb) quite precisely to 20 (18+X and Y) chromosomes, leaving only 212 Mb of unplaced scaffolds.
The RT used a very clever strategy for the genome annotation. After screening for repeats, they run a three-staged procedure to ensure that the annotation is of a high quality. First, they run so-called targeted-stage. For this stage, they downloaded from UniProt SwissProt/TrEMBL all pig protein sequences and then matched them against assembled genome with Exonerate/Genewise to predict the models of coding sequence. Second, they applied similarity stage, where they generated additional coding models using proteins from the related species. Thirdly, they obtained RNA-seq data and used it them to search for expressed regions in the genome. Finally, they obtained a consensus prediction for the transcripts based on these three stages (see Fig.1).
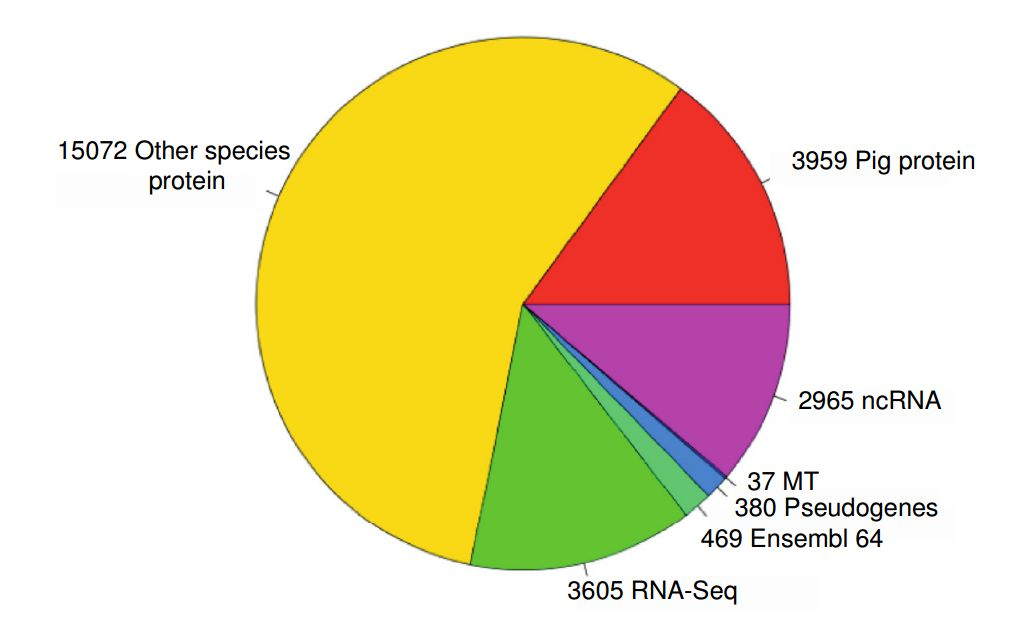
identified and 2,965 non-coding RNAs (ncRNAs). Of the protein coding transcripts 3,605 were made from RNASeq only, 15,072 came from proteins from other species. 3,959 transcripts were pig specific, 37 transcripts were mitochondrial.
Evolution of porcine genome compared to other mammalian genomes
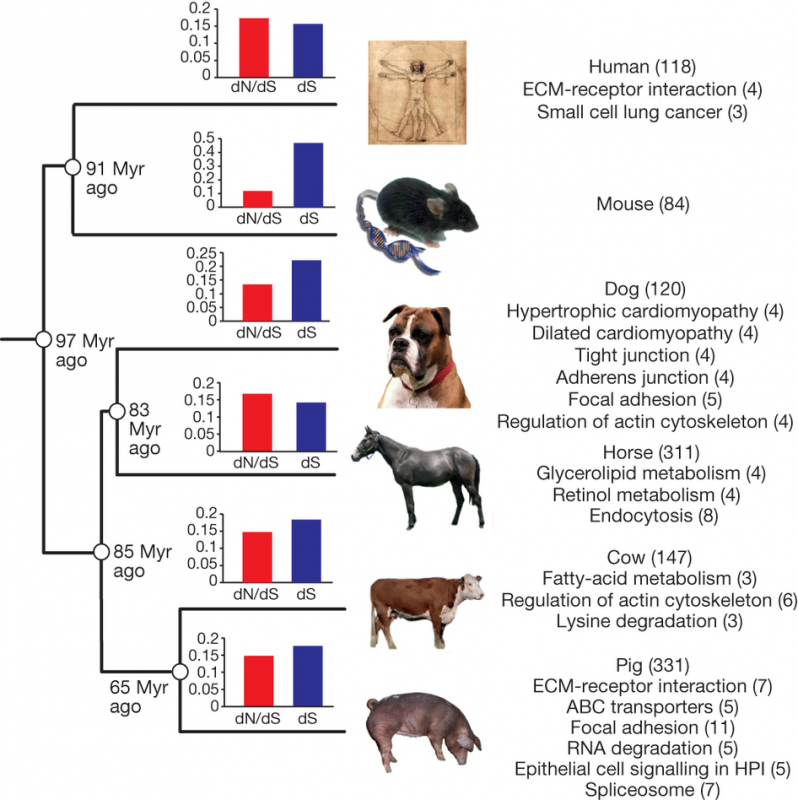
As the first analysis, the RT ran the comparison of pig genome with five more mammalian genomes – human, mouse, dog, horse and cow.
First, they extracted only 1:1 orthologous from the total gene set, used branch-site model to calculate the dN/dS ratio and analyzed proteins with accelerated evolution for enrichment for specific biological processes. In general, dS (0.160) and dN/dS ratio (0.144) in pig lineage were similar to other mammals (0.138–0.201) except for the mouse (0.458), suggesting similar evolutionary rates and intermediate level of purifying selection. Specific pathways significantly (P< 0.05) enriched within the pig group are shown on Fig. 2. However, it was not entirely clear if the pathway analysis was corrected for multiple testing.
Second, the RT attempted to analyze a subset of immune-related genes to find out which proteins evolve especially fast and also which gene families have experienced gene-family expansions. The RT thoroughly annotated genes related to immunity and compiled an impressive dataset on gene duplications. However, the analysis itself could have been greatly improved if it was run with a specific hypothesis in mind or at least if there was a more detailed explanation on how exactly gene family evolution was investigated. Have they used a birth-death model? Was it a simple Student t-test? Unfortunately, the Supplementary Information just like the article itself, leave the reader only wondering about it. The results of the “unknown” analysis, nevertheless, suggest that in porcine genome there are expansions of IFN, IL1B, CD36, CD68, CD163, CRP and IFIT1 genes. Interested reader may want to check out yet another paper from the same RT that deals exclusively with the evolution of the porcine immunome.
I am going to put aside the whole part on genome re-arrangements, conservation of synteny and evolutionary breakpoints as not to expand the blog post to unreadable size.
Analyze population divergence and domestication
The second part of the article deals primarily with the history of the pig population and highlights some interesting insights into pig domestication.
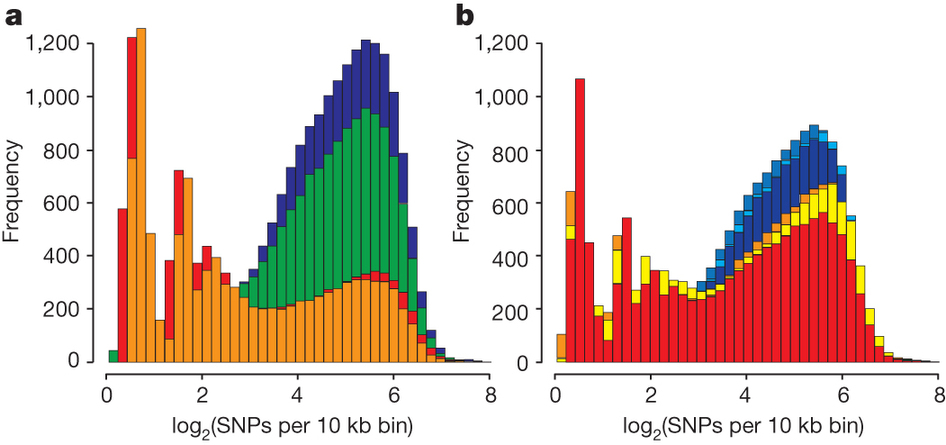
To run this part of the analysis, the RT has additionally sequenced 4 Asian and 6 European wild boars and compiled a dataset on single nucleotide polymorphisms for each individual (the dataset included both wild individuals and domesticated breeds from the previous part). As expected, the nucleotide heterozygocity is higher among Asian wild boars compared to European (see Fig. 3a). Furthermore, high peaks of low heterozygocity among European wild boars may evidence a past bottleneck which the population experienced when migrating out from Asia. In contrast, the nucleotide heterozygocity of pig breeds (i.e. domesticated pig) shows quite a surprising pattern (Fig. 3b): (1) the genetic heterozygocity is relatively similar between European and Asian breeds; and (2) not only this diversity is only mildly reduced in Asian breeds compared to Asian wild individuals, but also the diversity of European breeds is higher compared to European wild boars. What might explain such pattern?
Sadly, the story behind this pattern is greatly simplified in the article itself, and lots of interesting details and discussions are left aside for the Supplementary Materials. Just in brief, the RT found a clear signal of admixture between wild Asian and European boars and between European and Asian breeds. For wild individuals they suggest that it may be multiple migrations of Asian wild boars across Eurasia during the later stage of the Pleistocene that produced an admixture signal between wild boars.
For domesticated breeds the story is rather complex and includes multiple causes of admixture such as trading of Asian breeds and mixing it with European ones in late 18th and 19th centuries, multiple domestication origins, husbandry practices and incomplete lineage sorting. The only clear conclusions are that (1) domestication of wild boar has happened at least twice and independently in Asia and Europe (2) there were numerous admixture events between wild boars from Asia and Europe (late Pleistocene), between domesticated breeds with wild boars in both Europe and Asia (over 10 000 years), and finally between domesticated breeds of Europe and domesticated breeds of Asia (18-20th centuries).
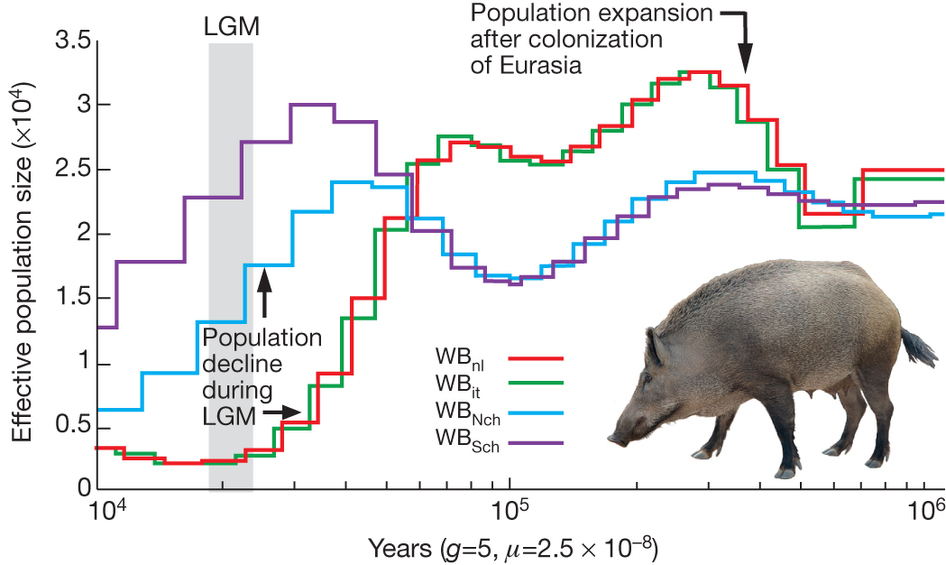
The second part of the story tells us about the demographic history of Asian and European populations. For this analysis the RT used a pair-wise sequentially Markovian coalescence model. They find that the population of wild boar has increased in size once arriving into Europe, but then both European and Asian population showed a decline in population size and this decline is much more pronounced in European population (Fig. 4). The RT team suggests that population size declines due to climatic oscillations with a down peak around Last Glacial Maximum (20 000 years ago). However, personally, I would not disregard hunting practices as potential cause of wild boar population decline, because humans have already populated Eurasia at that time and probably knew how to hunt boars. Another detail that could have been worth adding is confidence intervals on demographic history – for now the reader is left with a guess on how accurate the observed lines are.
Lastly, the RT looked at the selective sweeps on the pig genome and for this part of analysis they followed strategy from Green et al. 2010. In general, they find that regions with putative selective sweeps are over-represented with genes involved into RNA splicing and RNA processing. However, they exclude completely from the analysis non-protein coding regions, while it would be clearly interesting to look at given that they find a quite some sweeps associated with genes involved with RNA splicing and processing.
In sum, the paper is incredibly dense, includes various kinds of analyses and results, and to me looks like an overview of 10 years of great work of dozens of people. I believe we are going to see (and already seeing) more detailed papers on each section of this article and each of these future publications will unravel fascinating details on evolution of pig genome from different biological perspectives.
Groenen MA, Archibald AL, Uenishi H, Tuggle CK, Takeuchi Y, Rothschild MF, Rogel-Gaillard C, Park C, Milan D, Megens HJ, Li S, Larkin DM, Kim H, Frantz LA, Caccamo M, Ahn H, Aken BL, Anselmo A, Anthon C, Auvil L, Badaoui B, Beattie CW, Bendixen C, Berman D, Blecha F, Blomberg J, Bolund L, Bosse M, Botti S, Bujie Z, Bystrom M, Capitanu B, Carvalho-Silva D, Chardon P, Chen C, Cheng R, Choi SH, Chow W, Clark RC, Clee C, Crooijmans RP, Dawson HD, Dehais P, De Sapio F, Dibbits B, Drou N, Du ZQ, Eversole K, Fadista J, Fairley S, Faraut T, Faulkner GJ, Fowler KE, Fredholm M, Fritz E, Gilbert JG, Giuffra E, Gorodkin J, Griffin DK, Harrow JL, Hayward A, Howe K, Hu ZL, Humphray SJ, Hunt T, Hornshøj H, Jeon JT, Jern P, Jones M, Jurka J, Kanamori H, Kapetanovic R, Kim J, Kim JH, Kim KW, Kim TH, Larson G, Lee K, Lee KT, Leggett R, Lewin HA, Li Y, Liu W, Loveland JE, Lu Y, Lunney JK, Ma J, Madsen O, Mann K, Matthews L, McLaren S, Morozumi T, Murtaugh MP, Narayan J, Nguyen DT, Ni P, Oh SJ, Onteru S, Panitz F, Park EW, Park HS, Pascal G, Paudel Y, Perez-Enciso M, Ramirez-Gonzalez R, Reecy JM, Rodriguez-Zas S, Rohrer GA, Rund L, Sang Y, Schachtschneider K, Schraiber JG, Schwartz J, Scobie L, Scott C, Searle S, Servin B, Southey BR, Sperber G, Stadler P, Sweedler JV, Tafer H, Thomsen B, Wali R, Wang J, Wang J, White S, Xu X, Yerle M, Zhang G, Zhang J, Zhang J, Zhao S, Rogers J, Churcher C, & Schook LB (2012). Analyses of pig genomes provide insight into porcine demography and evolution. Nature, 491 (7424), 393-8 PMID: 23151582