![]()
Humans and chimpanzees share about 95% of their DNA. Having this in mind the recently published paper of Prado-Martinez et al. 2013, focusing at identifying great-ape genetic variation and resolving great-ape population history (based on historical-effective population sizes) reflects a comprehensive catalogue of great-ape genetic diversity to which the human genome can be compared to. On the other hand, the paper provides a framework of genetically resources between and within species/populations that can be used to improve conservation-management and breeding programs for captive and wild great-ape populations, which suffer dramatic reductions in suitable habitat and are highly endangered.
79 wild and captive born individuals were sequenced, including all six great ape species and seven subspecies. Nine human genomes, three african and six non-african individuals complemented the study. Variant-calls were performed using GATK. Totally, they discovered 84 million fixed substitutions and 88.8 million SNPs. In general they provide very good genomic data, using several quality filters and having less than 2% contamination between samples. To test the quality of SNV-calls they applied three independent validation experiments leading to a concordance of 86-99%.
A difference compared to previous discussed papers, in the GEE-tutorial, is that in this article they didn’t look at the function of genes. Otherwise, the applied methods encountering Neighbor-Joining trees, genome-wide heterozygosity rate, PSMC, ILS etc. are similar to Freedman et al. 2014 (Genome Sequencing Highlights the Dynamic Early History of Dogs).
What is striking that among the past years there occurred a rapid development of new software-tools and methods, which enables sequencing/data-generation with greater quantity and better quality. Therefore, when comparing different studies it is important to exactly determine what kind of software’s and methods were used specifically, in order to draw meaningful inferences.
Generally, the paper prompted for a fruitful discussion including many basic concepts and terms underlying population genetics: For example, in Figure 1b (see below) measurement of heterozygosity is used to infer genetic diversity based on distance-estimates. What has to be considered by interpreting this figure is that there exist different measures of heterozygosity. Here, heterozygosity measured at the individual level got compared to the species heterzygosity level.
Another example is figure 1c, where the level of inbreeding was measured by runs of homozygosity. In almost all wild populations they found extensive inbreeding.
Thereby, the relationship between the coefficient of inbreeding (FROH) and the number of autozygous > 1 mega base segment is given. Here, it is important to be aware that “homozygote” means that two alleles are identical, whereas “autozygote” means homozygosity in which the two alleles are identical by descent. What is reflected in figure 1c is that both distributions seem to depend on each other, showing either large values (eastern low land gorillas) or smaller values (chimpanzee’s subspecies). However, some scepsis of going from homozygosity to autozygosity species specific-threshold remained.
When discussing figure 1, another important finding was that the geographical-position can affect the amount of heterozygosity within a population. Since individuals/groups that are at the edge of a continuously distributed population find together in smaller groups, mating and expansion is restricted to a subset of individuals. Accordingly, this results in a loss of heterozygosity at the leading edge of a range-expansion. This mechanism is also evident for the human-species that represents a unique out of Africa-origin, whereas expansion to Asia and South-America led to lower numbers of genetic diversity at the latter sub-regions.
Figure 1:
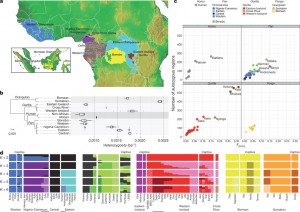
As illustrated in figure 1, they found strong support for genetically distinct populations and sub-populations among great-ape species. Common chimpanzees are split into two distinct populations. Among all species chimpanzees showed the greatest stratification, which is consistent with the values obtained from the PSMC-analysis (Figure 3) based on the neutral-theory that selection acts more intensely on populations with larger sizes. Using a set of methods (D-statistic and tree mix model) they infer signals of gene flow among different species, as for example for Nigeria-Cameroon and Eastern chimpanzees that complicate the analysis.
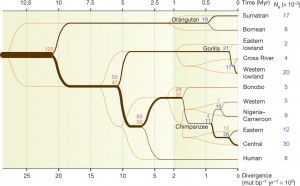
To reconstruct the history of species and subspecies they used a combination of methods (COALHMM, ILS, PSMC-analysis, and ABC) that are sensitive to branching processes and changes in effective-population sizes. Accordingly, inferred speciation times were used to estimate the most ancient split times and effective population sizes among great-ape species (see Figure 2 below).
For a more detailed explanation please use the link provided with the figure.
Figure 2:
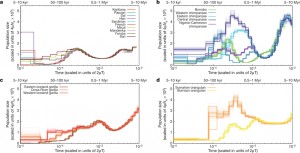
Applying PSMC-analysis, they inferred historical effective population sizes of all great-ape species (see Figure 3 below). Thereby, the authors were very thorough to estimate demographic-processes (detailed explanation is given in Supplementary Information), compared to previous discussed papers like the “Amborella Genome Project 2013” (The Amborella Genome and the Evolution of Flowering Plants) where the demographic processes were based on rather weak data.
Among different species, inferred effective population sizes have varied a lot over time, which seems to have had a strong effect on genetic diversity, as discussed for chimpanzees above. Eastern low land gorillas show the lowest effective population sizes, which correspond well with their history of ancient and recent inbreeding.
By comparing Figure 3 and Figure 2 it is apparent that both figures infer the same split-times (100-300 thousand years ago) for chimpanzee’s subspecies divergence.
What would be expected if any additional individual would be analyzed with the PSMC method? The answer is that it wouldn’t change the pattern greatly, since the species strongly show clustered distributions.
Figure 3:
Analysis of loss of function-mutations revealed no difference, throughout human and other great ape lineages, thereby not supporting the theory that loss of gene function may was a common evolutionary mechanism, important for the success of humans.
Summary: In my point of view, this LETTER emphasizes its findings on its practical orientated-approach. The underlying methods are thoroughly described in the Supplementary Information, forming a rather big content. Since critical viewers may state that this study did not reveal many new insights to explain the obtained diversity, I think that these kinds of studies are quite promising to more efficiently manage conservation-programs and build-up future studies based on traits like ancestry informative markers. Despite this, I think that the article also has some potential as flagship-study for other species that are spatially depending on the tropical-rainforest emphasizing the threat of this unique habitat.
Prado-Martinez, J., Sudmant, P., Kidd, J., Li, H., Kelley, J., Lorente-Galdos, B., Veeramah, K., Woerner, A., O’Connor, T., Santpere, G., Cagan, A., Theunert, C., Casals, F., Laayouni, H., Munch, K., Hobolth, A., Halager, A., Malig, M., Hernandez-Rodriguez, J., Hernando-Herraez, I., Prüfer, K., Pybus, M., Johnstone, L., Lachmann, M., Alkan, C., Twigg, D., Petit, N., Baker, C., Hormozdiari, F., Fernandez-Callejo, M., Dabad, M., Wilson, M., Stevison, L., Camprubí, C., Carvalho, T., Ruiz-Herrera, A., Vives, L., Mele, M., Abello,
T., Kondova, I., Bontrop, R., Pusey, A., Lankester, F., Kiyang, J., Bergl, R., Lonsdorf, E., Myers, S., Ventura, M., Gagneux, P., Comas, D., Siegismund, H., Blanc, J., Agueda-Calpena, L., Gut, M., Fulton, L., Tishkoff, S., Mullikin, J., Wilson, R., Gut,
I., Gonder, M., Ryder, O., Hahn, B., Navarro, A., Akey, J., Bertranpetit, J., Reich, D., Mailund, T., Schierup, M., Hvilsom, C., Andrés, A., Wall, J., Bustamante, C., Hammer, M., Eichler, E., & Marques-Bonet, T. (2013). Great ape genetic diversity and
population history Nature, 499 (7459), 471-475 DOI: 10.1038/nature12228