![]()
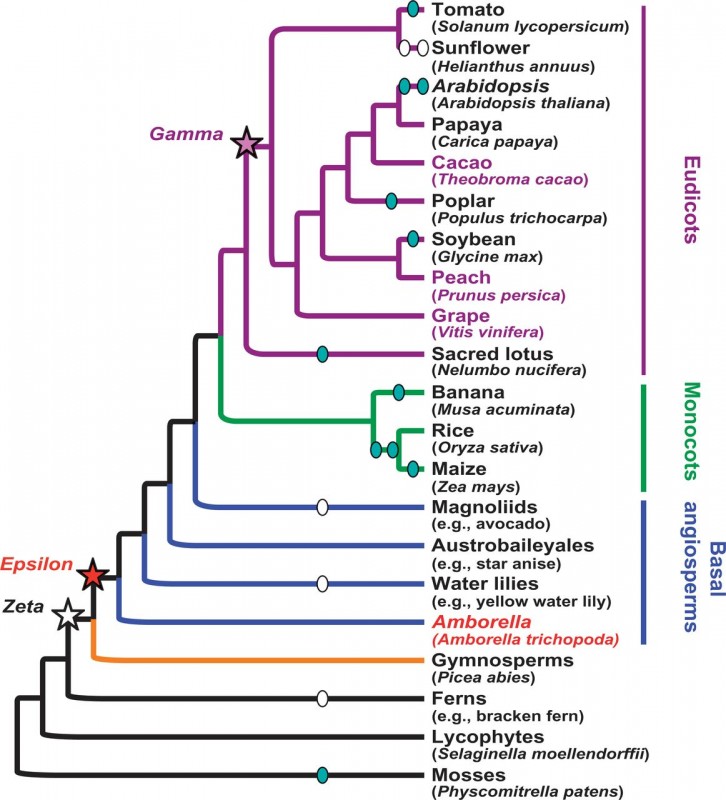
Amborella trichopoda, an endemic species to New Caledonia, is the most early-diverging taxa of flowering plants (angiosperms, Figure 1). As such, the sequencing of its genome was of considerable interest for the investigation of the emergence and evolution of this highly diverse lineage presenting at least 350’00 species.
In this work, the Amborella genome project (http://www.amborella.org/) reports the draft genome sequence for A. trichopoda. Notably, it was used as reference for the reconstruction of genomic features and architecture of the most recent common ancestor of living angiosperms, the investigation of gene families specific to flowering plants, and the investigation of the Amborella population structure.
Genome structure
The identification of frequent duplicated collinear genes (Figure 2a) within A. trichopoda genome provides evidence of an a ancient whole genome duplication (WGD). WGD is known to be a pervasive feature in the evolution of plants, with modern plants frequently presenting traces of multiple past duplication events. Thus, a comparison with Vitis vinifera (grape) showed that the genome of A. trichopoda is almost entirely covered by three syntenic grape regions (Figure 2b and 2c). This 1:3 relationship between those two genomes indicates that the WGD detected in A. trichopoda occurred in the common ancestor of the two species (an event referred as Epsilon, Figure 1), and confirms that the divergence of A. trichopoda at least 160 Ma ago predates the observed genome triplication of Vitis vinifera (referred as Gamma, Figure 1). In addition, the A. trichopoda genome shows no evidence of more recent duplication event.
A phylogenomic approach was then used to confirm results based on synteny analysis. First, with the reconstruction of the phylogeny of 11,519 gene families supporting the fact that duplicated genes specific to A. trichopoda are unfrequent. Inference of the duplication time significantly supported two divergence times of respectively 244 and 341 mya, corresponding to the previously identified Zeta and Epsilon WGD (Figure1). The fact that the Zeta duplication was not supported by syntenic analysis is probably due to extensive gene loss and rearrangements that occurred since this ancient event. A second phylogenetic analysis of 155 syntenic genes pairs from six manually curated duplicated blocks supports as well that Epsilon WGD predates the divergence of A. trichopoda.
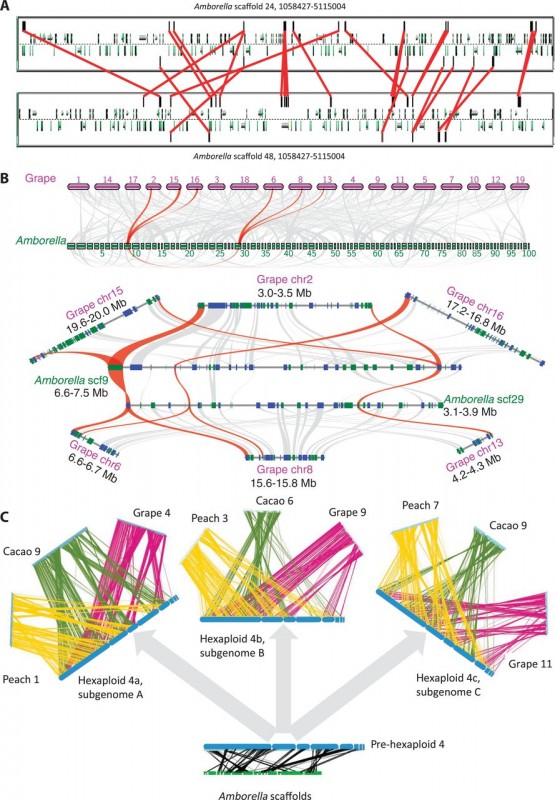
The ancestral gene order of the eudicot ancestor was reconstructed based on three eudicot genomes presenting structurally similar genomes and clear patterns of paralogy among gene copies: grape (V. vinifera), peach (Prunus persica), and cacao (Theobroma cacao). A. trichopoda was used as an outgroup. Seven hypothetical ancestral chromosomes were reconstructed. This reconstruction will help to understand the evolution of eudicot lineages after the Gamma hexaploidy event. Figure 2c presents the alignment of one ancestral chromosome and triplicates blocks of genes in the three rosid genomes.
Ancestral gene family content, origin and history of angiosperm genes
To investigate the ancestral gene content and evolution of genes families in the different lineages of the land plant phylogeny, protein coding genes from 22 sequenced land-plants were clustered into 53,136 orthogroups. Subsequent clustering merged those orthogroups into 6054 super-orthogroups. Changes in genes families are more important for terminal branches, and the branch leading to all angiosperms. Additional analysis including spruce genome, gymnosperm and basal angiosperm transcript assemblies led to the identification of 1179 orthogroups which seems to be specific to angiosperms.
We discussed the fact that this clustering method is based on BLASTp analyses. Amino acid sequences are not necessarily well conserved between distantly related proteins, and cutoffs used for clustering influence the number of inferred unique gene families. Most genes lineages (70%) with function linked to flowering were present in the most recent common ancestor of all seed plants, highlighting the fact that novelty is generally not linked with the emergence of drastically new gene families.
They further detailed gene family expansions linked with flowering, such as the MADS-box transcription factors, seed storage globulins and cell wall and lignin genes.
Transposable elements
One striking feature of the A. trichopoda genome is that average age of identifiable transposable elements (TEs) in A. trichopoda is considerably older than that of other angiosperm genomes. Terminal repeats of LTR retrotransposons presented extensive degree of divergence. Endogenous pararetroviruses (EPRVs) and TEs still account for 57.2% of the nonambiguous nucleotides in the A. trichopoda genome (668 Mb), but only few TEs families presented signal of recent activity, with an estimated insertion date of more than 10Ma for most of the TEs. The lack of recent transposon activity in the A. trichopoda genome may be due to very effective silencing or the loss of active transposases.
Population genomics and conservation
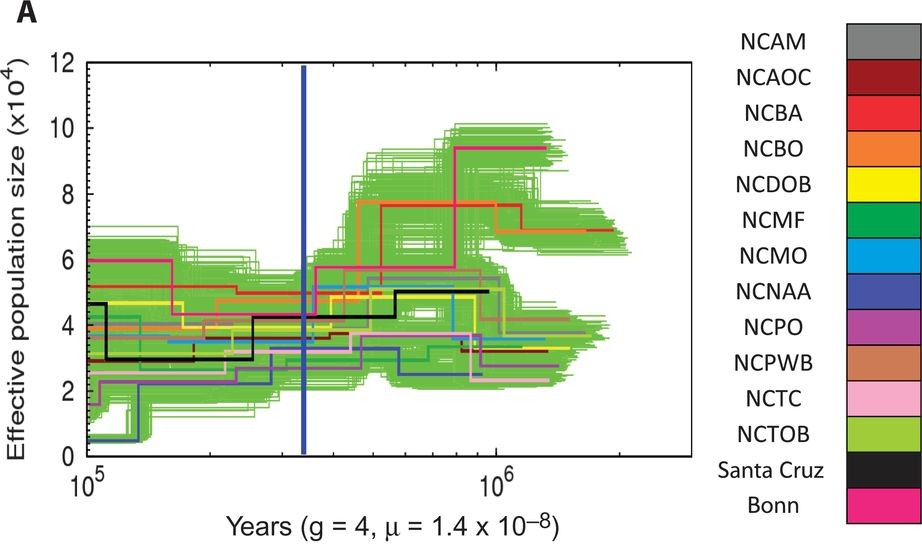
They finally investigated population history and structure of Amborella. Twelve genomes of 12 individuals sampled from nearly all known populations from New Caledionia were resequenced. The Pairwise Sequentially Markovian Coalescent (PSMC) method, which uses Single Nucleotide Polymorphism (SNP) data to infer past changes in effective population size, was used to investigate population history of the 12 Amborella populations (Figure 3). The coalescent time of the 12 genomes was estimated to be 9.0-2Ma. They discussed evidences suggesting population bottlenecks, sub-lineages admixture and reduction in effective population size in recent past. Nevertheless, given the boostrap clouds visible on Figure 2, those results are not strongly supported by the data. The number of identified SNP varied importantly depending the parameters used for the SNP calling: from 1,903,437 SNP with stringent parameters to 5,131,595 SNP with less stringent parameters. As the median read depth was quite low for some samples (6X for several samples), the less stringent analysis was retained to perform the subsequent PSMC and population structure analysis, casting doubt on the value of those results.
In conclusion, the analysis of the draft genome sequence of this basal Angiosperm gave first hints of the genome architecture and gene content of ancestral flowering plants, and promises to be a valuable tool for the investigation of the evolution of flowering plants.
., Albert, V., Barbazuk, W., dePamphilis, C., Der, J., Leebens-Mack, J., Ma, H., Palmer, J., Rounsley, S., Sankoff, D., Schuster, S., Soltis, D., Soltis, P., Wessler, S., Wing, R., Albert, V., Ammiraju, J., Barbazuk, W., Chamala, S., Chanderbali, A., dePamphilis, C., Der, J., Determann, R., Leebens-Mack, J., Ma, H., Ralph, P., Rounsley, S., Schuster, S., Soltis, D., Soltis, P., Talag, J., Tomsho, L., Walts, B., Wanke, S., Wing, R., Albert, V., Barbazuk, W., Chamala, S., Chanderbali, A., Chang, T., Determann, R., Lan, T., Soltis, D., Soltis, P., Arikit, S., Axtell, M., Ayyampalayam, S., Barbazuk, W., Burnette, J., Chamala, S., De Paoli, E., dePamphilis, C., Der, J., Estill, J., Farrell, N., Harkess, A., Jiao, Y., Leebens-Mack, J., Liu, K., Mei, W., Meyers, B., Shahid, S., Wafula, E., Walts, B., Wessler, S., Zhai, J., Zhang, X., Albert, V., Carretero-Paulet, L., dePamphilis, C., Der, J., Jiao, Y., Leebens-Mack, J., Lyons, E., Sankoff, D., Tang, H., Wafula, E., Zheng, C., Albert, V., Altman, N., Barbazuk, W., Carretero-Paulet, L., dePamphilis, C., Der, J., Estill, J., Jiao, Y., Leebens-Mack, J., Liu, K., Mei, W., Wafula, E., Altman, N., Arikit, S., Axtell, M., Chamala, S., Chanderbali, A., Chen, F., Chen, J., Chiang, V., De Paoli, E., dePamphilis, C., Der, J., Determann, R., Fogliani, B., Guo, C., Harholt, J., Harkess, A., Job, C., Job, D., Kim, S., Kong, H., Leebens-Mack, J., Li, G., Li, L., Liu, J., Ma, H., Meyers, B., Park, J., Qi, X., Rajjou, L., Burtet-Sarramegna, V., Sederoff, R., Shahid, S., Soltis, D., Soltis, P., Sun, Y., Ulvskov, P., Villegente, M., Xue, J., Yeh, T., Yu, X., Zhai, J., Acosta, J., Albert, V., Barbazuk, W., Bruenn, R., Chamala, S., de Kochko, A., dePamphilis, C., Der, J., Herrera-Estrella, L., Ibarra-Laclette, E., Kirst, M., Leebens-Mack, J., Pissis, S., Poncet, V., Schuster, S., Soltis, D., Soltis, P., & Tomsho, L. (2013). The Amborella Genome and the Evolution of Flowering Plants Science, 342 (6165), 1241089-1241089 DOI: 10.1126/science.1241089